Comparison of results for validation

As part of my study concerned about shielding design, I need to prove that I validated code installation by reproducing some standard setup for which results were published. I picked this article (https://bit.ly/335flGu) and tried to obtain similar or close results using the details of their simulation. However, they used MCNP and different dose conversion coefficients.

I get a high dose rate value different from those of the reference article. I am wondering if it is appropriate to compare the results of the two codes or there is something I am missing. Please help.

Here I provide my flair file and spectrum data AmBe90.txt (2.2 KB) Code-Validation.flair (3.6 KB)

Dear Vincent,

many thanks for your question. Unfortunately I cannot have access to the article with the link you provided. Could you please share the full title?

You have correctly set PRECISIO as your DEFAULTS and this automatically enables the transport of neutrons down to thermal energies (1E-14 GeV) and pointwise treatment when available. Your material names correspond already to FLUKA material names, so FLUKA will call automatically the corresponding low energy neutron cross section (@ 296 K) if they exists.

You might want to add a LOW-MAT card for hydrogen specifying that your hydrogen is bound to carbon (the entry in Flair is H. CH2 bound natural Hydrogen, 296K) or you should add LOW-MAT cards for the elements you used if you need data at a different temperature (if available).
Could you please share as well your source routine?

Best,
Davide

Dear @dbozzato
Please find attached the reference article.
portable Am-Be source.pdf (735.7 KB)
I have been using the user routine package given in Sampling from energy spectra without writing my own.

Thank you

Dear Vincent,
thanks for sharing, now I have a clearer picture.

If you want to make a comparison, the first step would be to use the same spectrum as in the article you shared (or a reasonable approximation of it) for the sampling of the neutron primary energy. If I compare the one in the article to the one in the file you shared, there are substantial differences in the spectra features and in the granularity: the absolute values don’t matter for the sampling but of course the shape and presence/absence of peaks does.

As far as the dose conversion coefficients is concerned, the ones in the article. once converted to pSv cm^2, are at first glance not significantly different from those currently available in FLUKA so they shouldn’t be the source of your issue: with WHAT(2) of the USRBIN equal to DOSE-EQ you score ambient dose equivalent (H*(10)) by default but you can use the AUXSCORE card to change the sets and score effective dose as well. The sets EAPMP (effective dose for anterior posterior irradiation) or EWTMP (effective dose for worst possible irradiation condition) are both valid options (the latter more being more conservative)

If you will need to further refine your comparison, remember that FLUKA also allows to apply user defined coefficients using the fluscw routine.

Cheers,
Davide

dear @dbozzato
Thanks for the response. I must mention that the reason for the difference in spectra shape is that the one I used is expressed as iso-lethargic fluence from the IAEA spectra compendium, so it should be different from that in the article for which I don’t have data. Therefore, I will have to use the article that employed accessible spectrum data.

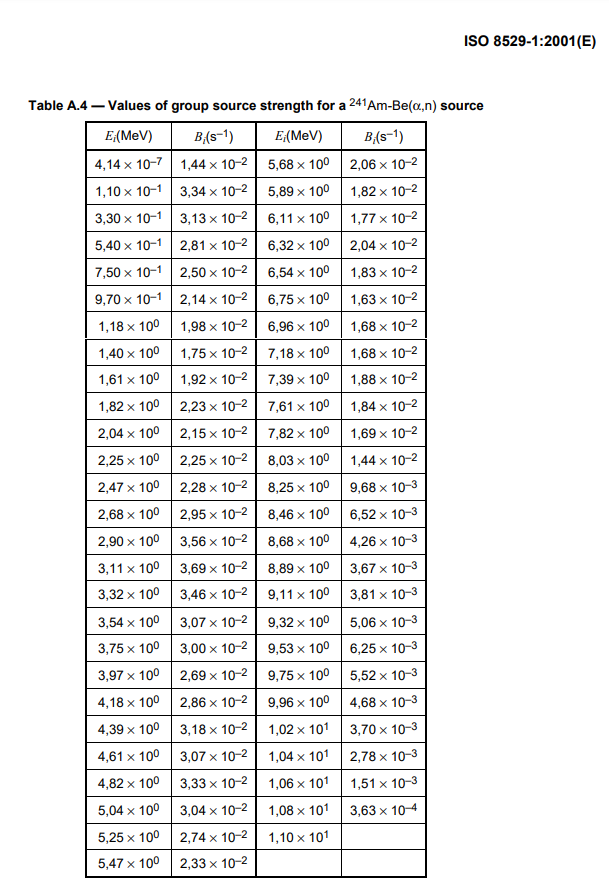
Try using the ISO spectrum. See attached.


AmBe_ISO.txt (1.1 KB)

1 Like

Thank you @sunil ,I will use it

1 Like

Thank you @sunil for sharing.
@Motlatsi_Vincent, if you encounter further problems, do not hesitate to ask!

Best,
Davide

The ISO spectrum was helpful. However, I still think I need the one whose shape matches the spectrum in the reference article.

Thanks so much

You can extract the plot data from the publication using a digitizer. One such app is
https://apps.automeris.io/wpd/

I have extracted values from the reference article using the Web Plot Digitizer. I checked the similarity of the spectrum shapes by producing the spectrum in FLUKA using Y to get the spectrum in terms of dN/dE. I see different shapes and relative intensities. I also get large dose rates that are above 100 uSv/h when the target dose rate is any value below 25 uSv/h.

How do I make sure I reproduce the same spectrum to compare the results of dose rates? Please suggest

here I provide the extracted data
extr.dat (2.0 KB)

Dear @Motlatsi_Vincent,
it is not very clear to me how you reproduced the spectrum in FLUKA. Could you please share the flair project and all the relevant files that you have used in your simulation? It would be much easier to advise then.
Many thanks,
Davide

Dear @dbozzato

Here I provide the Flair file
Spec.flair (2.1 KB)
Please note that I did not use source.f routine but I followed instructions in Sampling from energy spectra so that I could use the spectrum data.

After extracting data, I rearranged the energy values into energy bins as used in the ASCII file. The values in the last column are the intensities corresponding to the intensity values on the spectrum in the reference article. They were fed to the ASCII file without changes.

In FLUKA, I used the USRBDX card to score the neutron spectrum in linear energy of neutrons escaping the spherical region surrounding the source. In Flair, I chose Y to get a linear spectrum instead of a logarithmic one.

Hi @Motlatsi_Vincent
I am not sure if you got a reply to this, but I am able to reproduce the original spectrum exactly, using the data file you provided and the source.f that you pointed to. Change the energy binning to match the input spectrum range to get a clear plot ( I used 1e-4 to 0.1 GeV ), and, replace iron and air with vacuum (you are testing your source, so don’t modify it by introducing any material). While I used fluence (WHAT(1)=111) ( you had it as current) it may not matter with these changes.
You should get this. Spec_plot06.pdf (19.1 KB)
Cheers
Sunil

1 Like

Dear @sunil

Thank you for the response.
I managed to reproduce the original spectrum in FLUKA through your suggestion, as you did too. Our spectra, indeed, have similar shape and peaks to the one in reference article, but I thought the emission probability (in MeV-1) would be the same. Anyway, using this spectrum, I estimate the dose rate outside the tank designed as stated in one of my questions above, using the flair file in my first question. I still get high dose rates. Can the different emission probability be the reason for high dose rates?

Your suggestion will highly be appreciated.

Hi @Motlatsi_Vincent

I gave a cursory look at your original FLAIR file and the article that you had attached. Perhaps these points may help you cross check and improve (Caveat: I did not read the full article.)

Cross check the normalization of FLUKA results. FLUKA outputs are in pSv/primary. Use the same source strength (n/s) as given in the article and make sure your normalization gives you the same unit as in the article (mSv/h). I suggest you double check this to start with.

Check to see if the source was implemented as a volume source or a point source in the article. If it is a volume source, you will have to implement such a sampling also in the source.f for FLUKA.

Check to see if you got the geometry/materials correct. Check to see if you have the composition of the materials correct. I think there are some variations, but again, I might be wrong since I did not read the entire article.

There is also the fluence to dose conversion coefficient factor, but @dbozzato has already cross checked that, so you can rule out that a reason for the discrepancy for the time being.

Good luck!

Dear @Motlatsi_Vincent,
apologies for the late reply.

As @sunil pointed out, the spectrum sampling is correct and from a first glance the main source of discrepancy is in your geometry. You have implemented only an iron tank but, with respect to the article, you are missing the tungsten layer after the source (which is approximately cylindrical and not point like) and the borated polyethylene that acts as absorbing material. These two elements cannot be neglected at all!

You can try to reproduce as much as possible the geometry as in figure 5 of the article or using the geometry information the authors provided for M and L. This should guide into the right direction.

Let me know if you encounter issues in the next iteration.
Cheers,
Davide

Dear @dbozzato and @sunil

The iron tank was for testing the spectrum reproducibility.
I defined the geometry that is similar to their geometry and assigned the materials to regions accordingly ( materials: tungsten and borated polyethylene)
To ensure dose rate unit correspondence, I preferred to work in uSv/h and used their neutron emission rate and the conversion factor as 3600e-6 so that the dose rate limit is 0.025 mSv/h = 25 uSv/h.
I still get the high dose rates. I doubt that the borated polyethylene is correctly defined. They stated that the absorber is polyethylene plus 1.2% boron carbide (PE- 1.2 % B4C).

Please assist in defining this material, density, in particular, as I doubt it is correct, and it possibly impacts the calculations. Maybe it can solve this issue.

Here I provide the flair project.

Code-Validation.flair (3.2 KB)
extr.dat (2.0 KB)

Dear FLUKA users
I am reproducing the neutron shielding results obtained with the MCNP code in one article (check the article in Comparison of results for validation should there be a need).
So far I have defined a similar geometry, and I use a similar energy spectrum for the 241Am-Be neutron source.

The problem is with defining the material composition of Polyethylene containing 1.2 % boron carbide (I doubt I got the density of the composition correct).

The ultimate aim is to get the dose rates less than 0.025 mSv/h (=25 uSv/h) outside the geometry if everything is well defined.

Can you please assist in defining this material? Here I provide the flair project and the spectrum data. I used routine provided in Sampling from energy spectra
extr.dat (2.0 KB)
MCNP-results.flair (3.3 KB)

Dear @Motlatsi_Vincent,
I gave again a careful read to the article and tried to follow the references. Apologies for what will be a long answer. Let’s tackle the main points:

  • After giving a second look at the article, I see that the geometry that you implemented is perfectly correct.
  • To have a cylindrical spatially extended source, you also need to specify Rin, Rout, Hin and Hout which, for your case, can be set to 0, 1, 0 and 4 respectively: in this way you the neutron position will be sampled uniformly within the volume enclosed by your SOURCE region.
  • From what it is said in section 2.2.3 of the article, the boron carbide content is given as a mass fraction, not atomic. I have defined a new compound accordingly (see the flair file) and left the old one so that you can look at the small differences in the output file. Side note comment: there is no need to fill the WHAT(4) of the MATERIAL card specifying the number index of the material if your input file is name based.
  • You have correctly and efficiently used an R-Phi-Z scoring grid. In section 2.1 of the article it is said that the “counting meshes were set to 1.5cm x 1.5cm”, but nothing is said about the third dimension. It is not very clear but I suspect then that what is plotted is in reality an average over the remaining coordinate and this obviously gives lower numerical values. If I do the same with FLUKA (i.e. select a USRBIN with Cartesian mesh) and I then plot the results averaging along the remaining coordinate I get significantly lower values. Without the precise information on what it is plotted there is little chance of reproducing the results with fidelity.

Please have a look at the flair file and give it a go. Please let me know in case you have any question
MCNP-results_suggestions.flair (8.0 KB)

All the best,
Davide