I am a new fluka user. I intend to do some simulations using radioactive sources. I have started with the beta minus source (I-129) to see the bremsstrahlung effect and how shielding affects it.
I attached the file where there is no shield in place, and I have performed a run. The run finishes ok but it does not show the run time as well as the output afterwards. I129_n0_shield.flair (2.2 KB) .
Please check the correctness of my input file and assist.
The reason for which you don’t see the time per primary and the other info about time, is the fact that each cycle is very fast, indeed you run only 500 primaries per cycle. Once you increase the number of primaries you’ll see something.
Keep in mind that you can access the information about the time per primary looking in the .err and .out files (the info is printed in both, but I prefer to look in the .err as it is usually quicker to find it as the file is shorter).
There you will see lines like these:
500 0 1 2.8761864E-05 1.0000000E+30 0
NEXT SEEDS: 8226 0 0 0 0 0 181CD 3039 0 0
The number 2.8761864E-05 is the number of second per primaries.
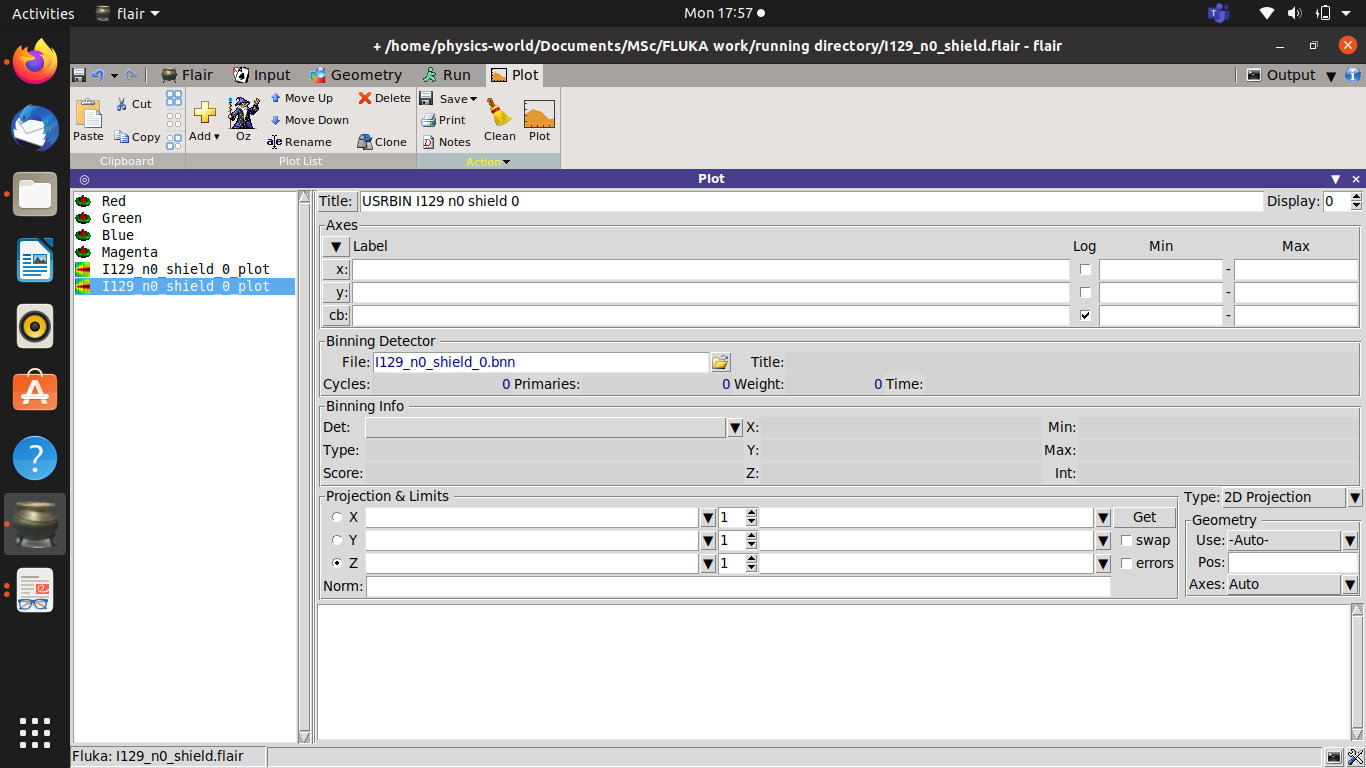
For what concerns instead the non-visualization of the results, I believe the problem is because you didn’t merge the results. Once the run is finished, in the “Run” tab, you have to click on the icon “Data” and then “Process” the output of the cycles in order to merge them together. Once you do so, in this specific case, you should get four files called: