The peaks that you are observing are coming from internal conversion electrons. It is better to visualize what is happening with the propagation medium set to VACUUMinstead of BERYLIUM.
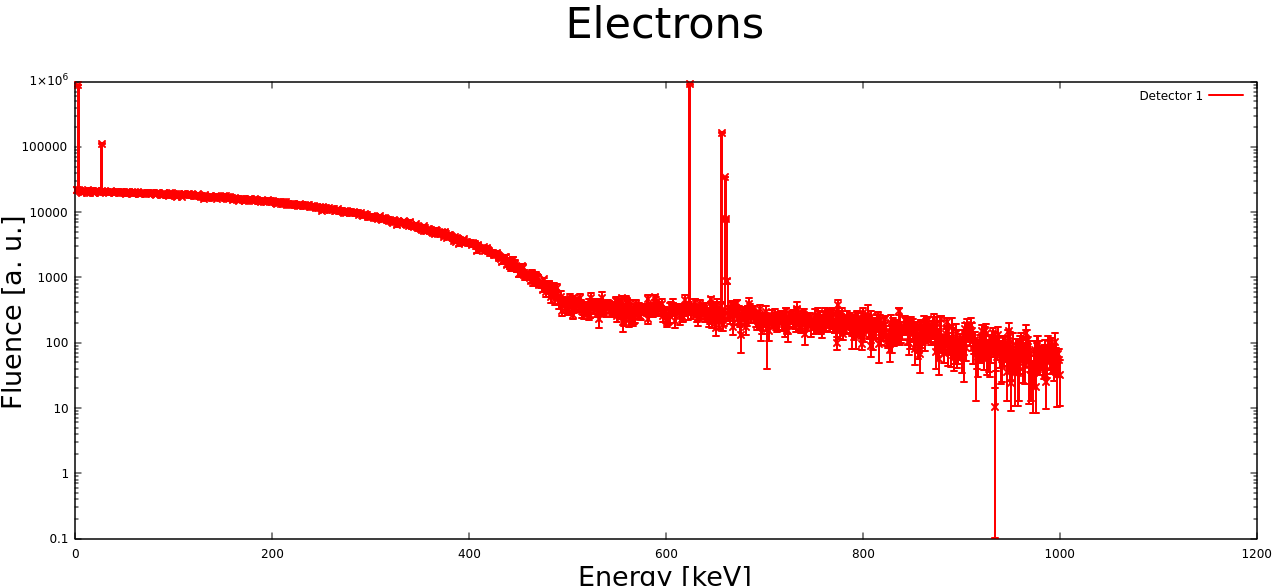
You can see tha beta electron spectrum up to ~500 keV (the actual beta spectrum goes in fact up to the Q=1.176 MeV, but a decay directly to the 137 Ba ground state happens only about 5% of the times). The low energy peaks are likely Auger electrons of few tens of keV. The peak at 624 keV and then the following peaks at ~655 keV and up are clear internal conversion electrons. I found this website that explains nicely what happens exactly for our example of 137Cs decay:
I hope that helps.
Now about your second question about the way to generate energy spectra, a similar problem was discussed in the following forum thread:
https://fluka-forum.web.cern.ch/t/scoring-energy-spectrum-cs-137-in-labr3/2845/8
Quoting the answer given there:
in practical terms, a viable solution is indeed to use the source.f routine (…) manually introducing the energy and branching ratios of the lines you care about and steering the sampling accordingly.
and then you can use DETECTcard as intended.
Best regards,
Jerzy