Thanks for your help, I implemented your suggestion in the EEDRAW ENTRY. That works.
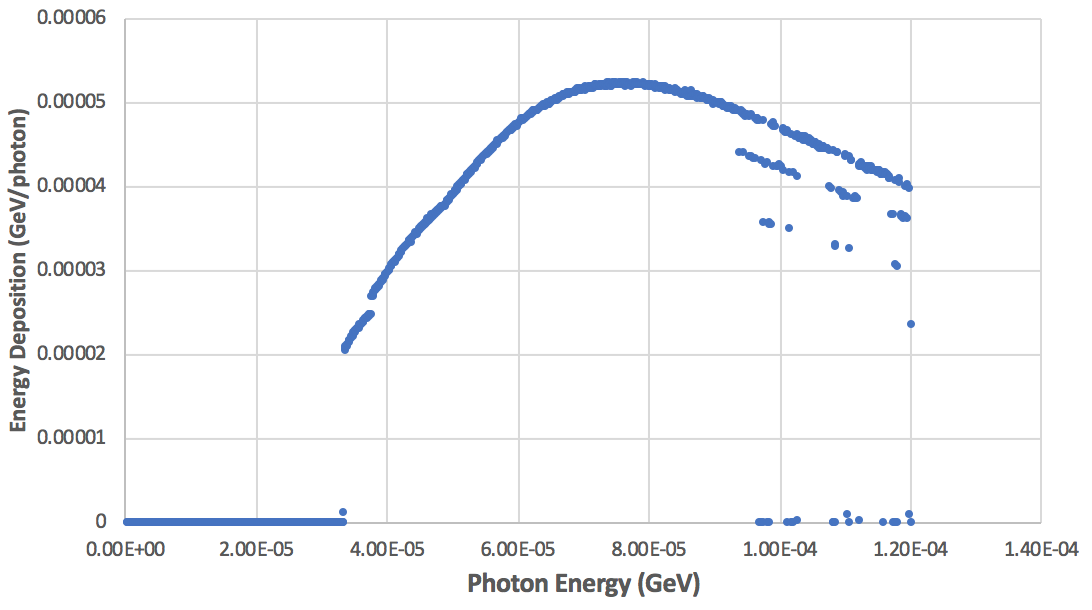
Then I plot the histo of incident energy versus energy deposition per primary, which seems not as expected.
The following are my input and source user routine. source_wangjl.f (9.3 KB) simu.inp (5.7 KB) mgdraw_pocariV2.f (11.6 KB)
I did run your simulation, and I didn’t see any suspicious difirence between the primary energy and the deposited energy in the region.
I calculated the difference between the two (E_{primary} - E_{deposited}).
In some of the cases I got negative value, but only in the range of -1e-18 – -1e-20. This is due to the numerical inaccuracies.
While the the positive difference can be explained so that the primary only partially stopped in the region used in mgdraw routine. The remaining energy deposited in a different region, or completely leaves the system.
So the total energy deposition calculation is correct, right?
I ran 1e8 primaries and plot a histo of incident energy versus energy deposition per primary. There exists a significant discrepancy with the one in the literature, both in amplitude(10 times larger) and shape(small K-shell). In the literature, the energy deposition was calculated by Geant4.
So I wonder the physics model may be different of these two simulation programs. Or did just I ignore something? I also uploaded the data processing code(.f90).
the calculation of the total energy deposition in your mgdraw routine looks fine, the numerical values seem to match with the ones in the EVENTBIN scoring.
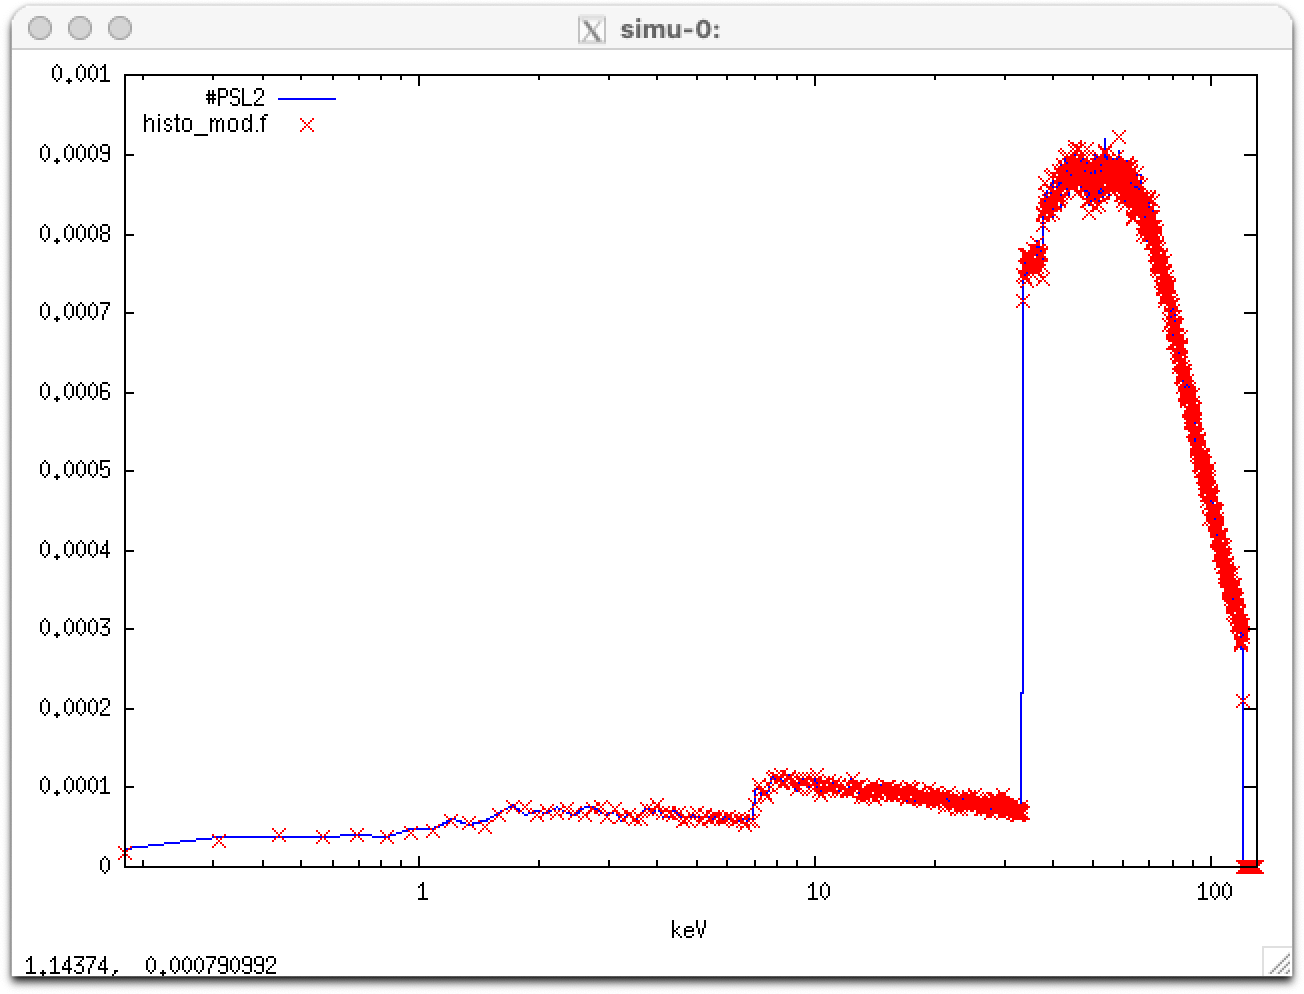
In your plot you see a cut at 33 keV, which is due to the default production cut of photons. Usually it is a good practice to set the production and transport thresholds to the same value. (1 keV in your case)
However, I couldn’t see the relation of the second figure and your geometry. Could you link the paper you are referencing?
Finally some comments:
The energy sampling of the primary particle can be done more effectively:
You can simply use the BEAM card to set a flat momentum distribution, or
in the source routine simply use:
XE = (E2 - E1) * FLRNDM(XDUMMY) + E1
In the data processing program you should initialize variables, before use them for summing values:
do i = 1, nchannels
    depositon(i) = 0.0d0
    nparticle(i) = 0
end do
The responses functions which I posted previously was a screenshot from a Chinese paper.
For simplicity, I built only one layer of the fliter(Al)+image plate. Therefore, only one response function is shown.
Following are the DOIs of related literature to which the above paper referred:
10.1063/1.2964231
10.1063/1.4775719
The first one gives the response functions, the second gives the image plate (MS) geometry and material descriptions. I realize that the geometry and material of my input file are not identical with the literature description, however, should not cause such big discrepancy.
Thanks for your comments, I have implemented them in my input file, and a new line is added.
EMFCUT -1E-06 1.0E-6 1.0 HYDROGEN @LASTMAT PROD-CUT
I ran your input and, as you can see from the blue line in the attached plot, the results of the DETECT card for the region PSL2 is much closer to plot you attached.
[I cannot make a one-to-one comparison as I miss details from the Chinese paper.]
The histogram calculation in your program is not correct:
The bin number is given by nbin = NINT(depo/ebins) + 1
The histogram entries are given by the array nparticle(i)
The red points are computed with a modified version of your histo.f, which I enclose for you convenience, and superimpose nicely with the blue line.
Thanks for your help. As I understand, in your attached plot:
    #PSL2 represents the output of DETECT card, incident energy versus total energy deposited in corresponding bin;
   histo_mod.f represents the output of the USERDUMP data, incident energy versus total number of energy deposited events (supposing normalized) in corresponding bin.
My questions are:
Why there a sharp cut in your plot, and a smooth increse with mine?
I ran 10 primaries and mannually check the output of MGDRAW routine and DETECT card, it is exactly the same. Why the accumulated edep given by MGDRAW is diffenrent with the DETECT card? Both in shape and absolute value. Instead, the normalized pirmary number accord with the DETECT card data perfectly.
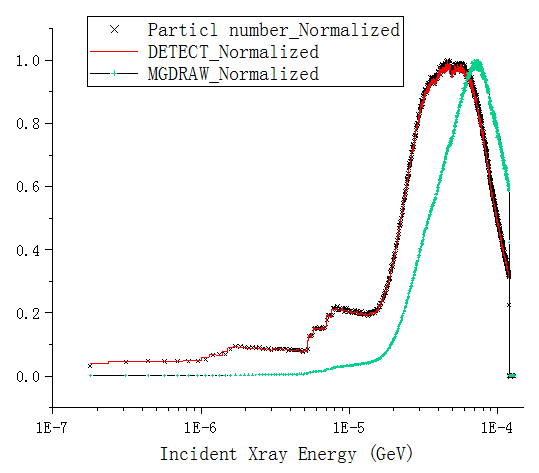
I do not fully understand your plot.
The label of the horizontal axis is “Incident Xray Energy” but the output of DETECT card and of the _fort.99 file from mgdraw.f are energy deposition in the region called PSL2.