dear @sniang
Thanks for your answer, I will try to clarify the issue further.
I modified the first code a bit, and I got good results, since I used a card DETECT
In order to select the isotope that I want, I used HI-PROPE .
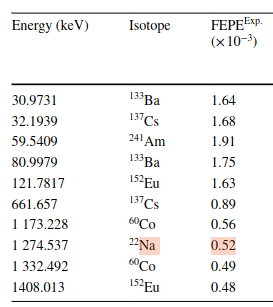
For Co-60 and Na-22 I got the same values compared to the experiment. But with the same code i don’t get good results for: Ba-133 / Cs-137 / Am-241 / Eu-152 .
the code for Co-60 : efficiency.inp (2.0 KB)
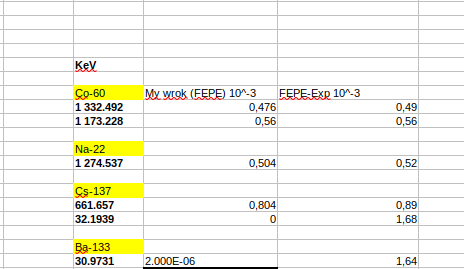
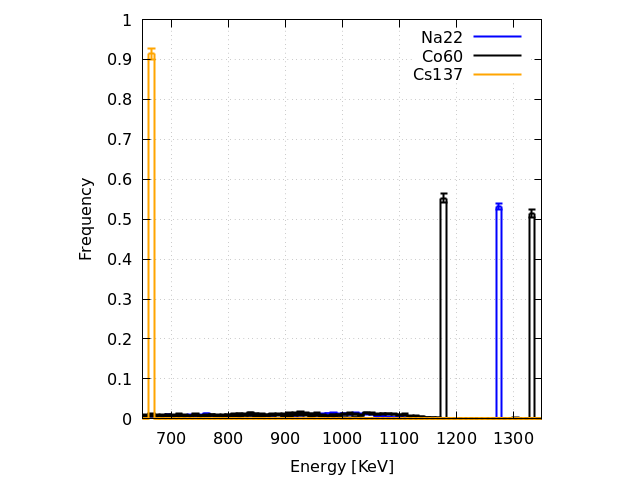
the result that i want :
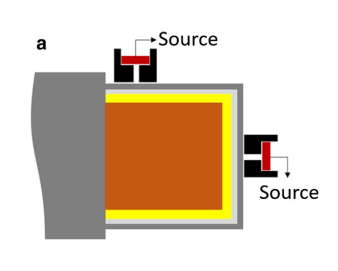
1-1 I am having a problem creating a source (Ba-133) as shown in the picture :
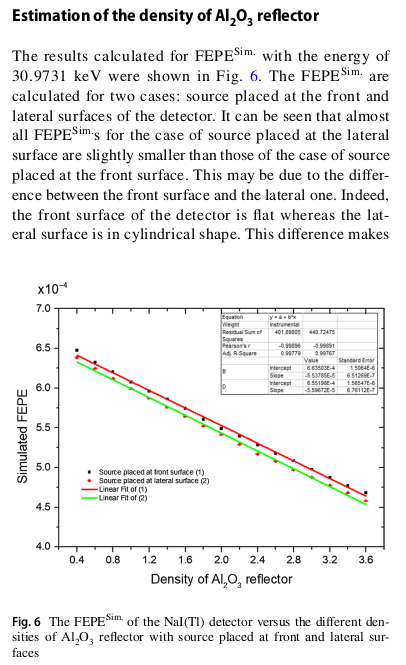
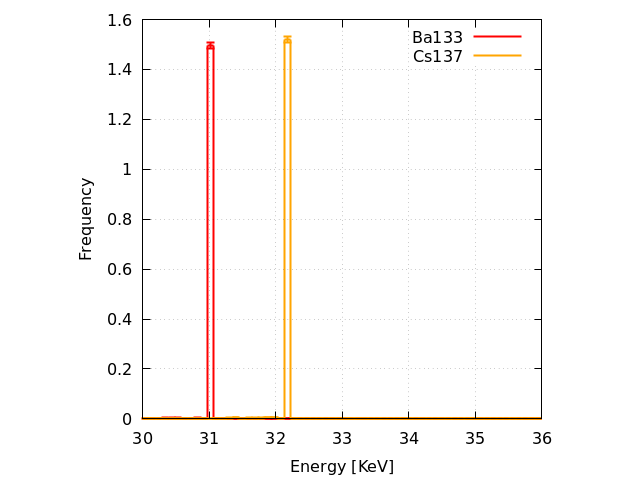
1-2 - i need to calculate efficiency values of the cylindrical NaI(Tl) detector with the energy of 30.9731 keV (Ba-133). I tried a lot to get a value like the one in a previous article, but to no avail :
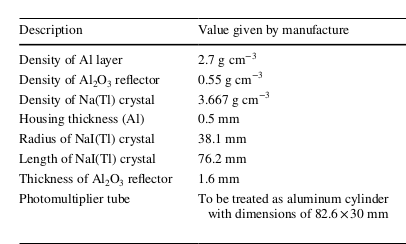
The author of the article has optimizing the detector for get the good value . so i want to do the same thing. he changes the value of the density of Al2O3 , length and radius of the NaI.
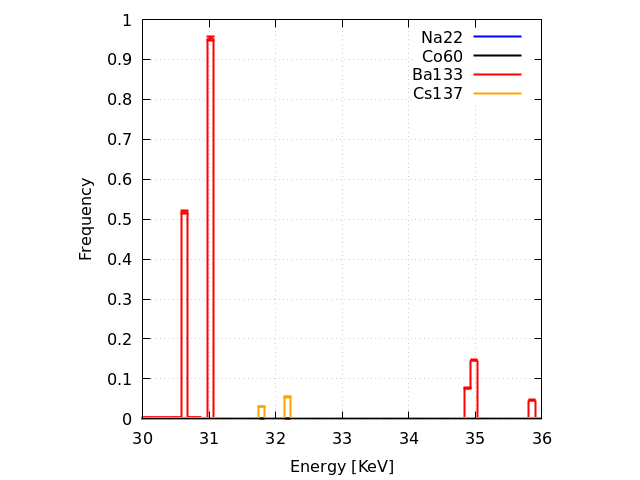
In order to find the correct value for the density, he uses energy 30.9731 keV (Ba-133) ; when i uses the same energy, i gets a very small FEPE value or equal to 0.
It means that all my problems occur in low energies ( 30.9 kev 32 kev 661 kev … )
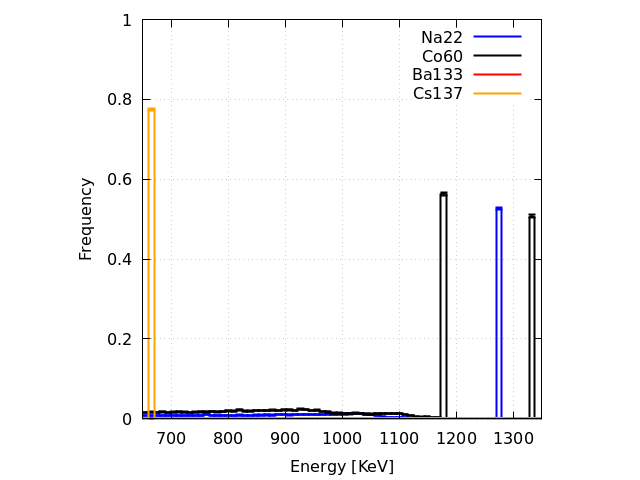
The input that I sent to you, through which I get good results in the large energies( 1 173.228 ; 1 274.537 ; 1 332.492 … ) but the small energies either i get results that are very far or equal to 0 . Therefore, I am optimizing the detector in the hope of obtaining good values at low energies
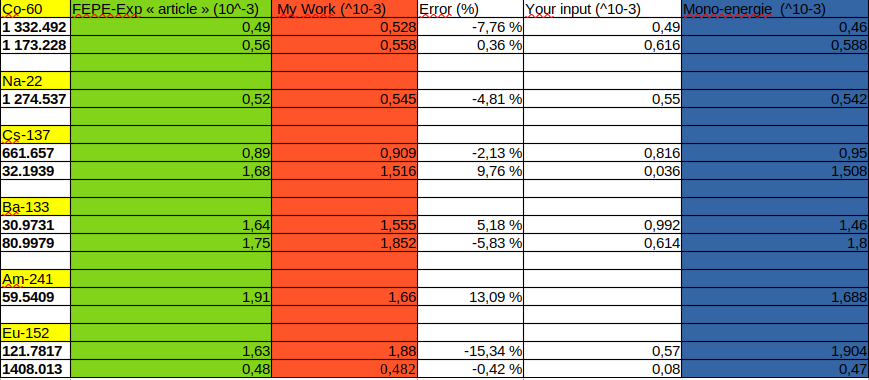
1-Here are my results compared to the experiment :
2- i get the results by simple method i will give you exemple of Co-60 :
i use this main input without “shielding” surrounding the source. old .inp (2.3 KB) old .flair (2.7 KB)
The same input that I mentioned earlier, the previous input i add the shielding in order to obtimizing the detector.
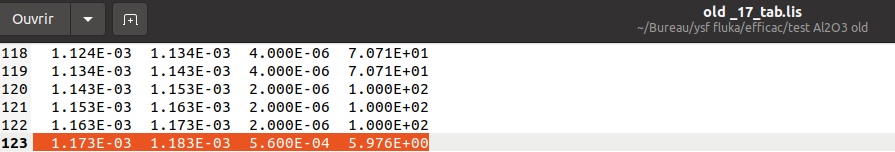
3- the DETECT card give output file (old _17_tab.lis) for Co-60 i look for energy 1173.228 to get the FEPE-sim
While waiting for your answer two days ago, I made another attempt to find a solution, I tried to adapted the solution you sent me the first time (mgdraw) with my last input. NaI_eff.inp (2.1 KB) NaI_eff.flair (2.5 KB)
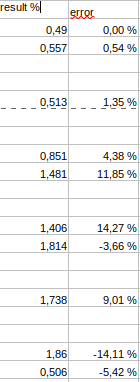
The results i obtained compared to the last results you sent me (color red : my work / green : result of article / blue : your work / error : between my result and article ).
I want to ask you what is the reason for this simple difference between what I get and the article, and do you have an idea to improve the results? I increased the number of elementary photons to 100 million. ( The error must be <= 5%).
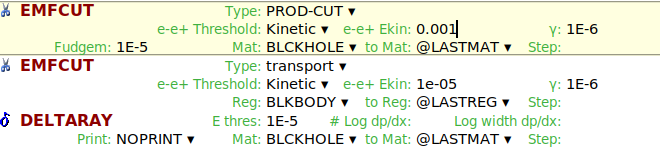
When I change some values, good results are obtained, but the same problem, some other results remain far from what is required : ( change e-e+ ekin form 1e-05 to 0.001)
i get this result : mgdraw : mgdraw_empty.f (9.4 KB)
Also, when the number of cycles is increased, the values change somewhat.
Thank you
MGDRAW routine:
The FLUKA input that I am currently developing with you on this thread has nothing to do with any user routine.
EMF-CUT:
If you increase the energy threshold, you will lose low energy particles, which is not what you want. Actually I advise you to make these thresholds as low as possible (1e-6 for e+e-, 1e-7for gamma in both EMF-cut card)
Your simulation
In the article you shared, the authors are optimising the parameters of the detector to match the MCNP simulation with experimental data. It is not surprising that if you use these optimised parameters you do not obtain the same results with FLUKA.
What you have to do, is to follow the full procedure described in the article, which means:
determining the density of Al2O3 using the collimated source (you probably have to implement the model of the collimator and I guess it’s in an article cited in the bibliography of the article)
determining the radius and the length of the cristal with the source placed at 40 cm.
Hi dear @sniang
Regarding the first question MGDRAW routine just I tried to adapted the solution you sent me the first time with my last input ( i get some good result like your input NaI_colibration_detect_photons.flair ).So i think I will adopt these results.
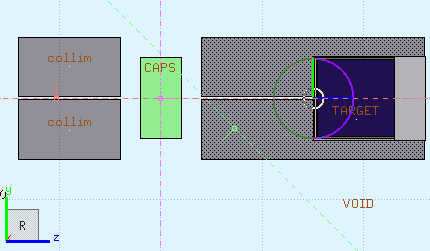
But in the same context, allow me to ask you about a simple problem : How can this detector be used to calculate the value of transmission value (I/I0), with I0 and I are incident and transmitted intensities.
my plot : mgdraw_empty.f (9.4 KB) attenu_1.inp (3.0 KB) attenu_1.flair (4.0 KB)
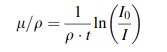
The goal is to send photons towards the green cylinder (H2O) Which will allow calculating a value (I/I0). When calculating this value, it will allow me to find the desired value from this search he mass attenuation coefficients from the Lambert–Beer law :
(Calculation of the mass attenuation coefficients were performed by the implementation of the simulation
model for the seven incident photon energies 59.5, 80.9, 140.5, 356.5, 661.6, 1173.2 and 1332.5 keV.)
My input : mgdraw_empty.f (9.4 KB) attenu_1.inp (3.0 KB) attenu_1.flair (4.0 KB)
Once again, the mgdraw routine has nothing to do with it, the goal of this routine is to dump informations as you can see in the manual. The proof being that the one you shared is empty and you didn’t activate the card to make to it work properly.
For your other question, you have to use the USRBDX card.
For more details, you can check:
Hi dear @sniang
1- I’ve tried to do this before, but I don’t get any results. All results = 0
2- I use this method : the simulations are first carried out without the H2O placed between the source and the detector to determine the value of “I0” . After that, the simulations are repeated with the H2O placed between the source and the detector with the thickness from 4 cm to obtain the value of " I ".
I did not find the problem where it lies, as the output has only zeros attenu_1_62_tab.lis (175.2 KB) attenu_1_62_sum.lis (298.5 KB) attenu_1.inp (3.0 KB) attenu_1.flair (4.0 KB)
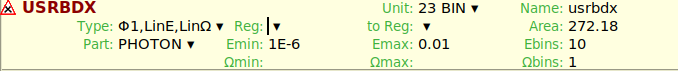
In the USRBDX card, you did not specify the second region defining the scoring boundary. Hence, the default is taken (region #2, as specified in the manual, which is your VOID) and, as a result, there is no shared boundary (between TARGET and VOID) to score on. That’s why you get zero.
Note in addition that you input a photon energy of 1 TeV!
Moreover, the fluence scoring you asked for will not give you the number of photons, rather the photon fluence (including photons crossing the boundary in the opposite direction).
Hi @ceruttif
Thank you for your help .
1- In my case, first i want to simulate without the H2O placed between the source and the detector to determine the value of incident photon intensity (I0). In this case, what should I put in the following fields: “Reg” and “to Reg” and What area is it ?
2- Regarding photon energy, you’re right, I forgot to put 1174KeV (A simple question in this range, what is the difference between putting the minus sign or not putting it before the energy ( 0.001173 or -1173KeV )
3- Same question number 1, but in the second case that I want to simulate with the H2O placed between the source and the detector to obtain the value of attenuated photon intensities " I ". Reg, To Reg and Area ?
4- Is there another way without the need to calculate the number of photons in the presence or absence of water, to find a ratio of (I0/I) directly in the output file. (Can you tell me where the value we need is written (I know I have to look in a file called “_sum.lis”).
I have already read the manual but things are not very clear to me .
You already have 2 people looking into this, it’s not proper etiquette to disregard their accurate feedback by involving still further people.
In the input you provide there is still the water region, but nevermind. In your input as it stands, you are passing a USRBDX card to score fluence, not current. Please select one-way current (I1-something). You are then scoring from Al2O3 to TARGET. Adapt as needed.
A simple question in this range, what is the difference between putting the minus sign or not putting it before the energy
Please refer to the powerful FLUKA manual section for the BEAM card, where you will find the answer immediately: 7.22.3. BEAM — FLUKA Manual
Same question number 1, but in the second case that I want to simulate with the H2O placed between the source and the detector to obtain the value of attenuated photon intensities " I ". Reg, To Reg and Area ?
See reply to question 1 above and adapt as needed.
4- Is there another way without the need to calculate the number of photons in the presence or absence of water, to find a ratio of (I0/I) directly in the output file. (Can you tell me where the value we need is written (I know I have to look in a file called “_sum.lis”).
In the _sum.lis you will find the integral already. Look for the line saying “Tot. resp.”.
I would like to express my gratitude to the members of the Fluka forum who have provided me with assistance and clarification regarding various issues. Their support has been invaluable, and I truly appreciate their willingness to help and share their knowledge. Thank you all for your contributions and for making the Fluka forum a helpful and welcoming community.