Peak energy deposition density and longitudinal power

Dear experts, I do research work on the beam dump. Now I want to calculate the Peak energy deposition density (J/cm3) and longitudinal power(J/cm) of the dump to estimate whether the material of the dump could tolerate. I got the results of ILC and I want to re-calculate the results by myself. Now I have two questions:

  1. For the Peak energy deposition density (J/cm3) of the dump, I use USRBIN/ENERGY card to calculate the energy deposition in the dump. In my opinion, I could get the Peak energy deposition density along beam axis from the 1D Projection with R ranging small enough (R is chosen from 0 to 1mm). The Norm is 3.2 considering the unit convert. However, my result is far from the result of ILC, as the following picture shown for beam size of 1mm.

This picture is simulation results of ILC.

image

The following picture is my simulation results for beam size of 1mm.

image
image

I am quite confused about the results and I want to find out the reason. Could experts give some advice? The Flair project is provided.

  1. For longitudinal power(J/cm) of the dump, have not found cards with similar function in the FM of FLUKA. Could experts provide some suggestion on how to calculate the longitudinal power(J/cm) along beam axis by FLUKA ? Thank you.

image

Hi Jia,

Let’s start from the second question. You can get the longitudinal energy deposition simply multiplying the energy deposition density by the cross sectional area of your detector.

For what concerns the first question, the energy deposition peak strongly depends on the beam size, as you have already seen. I would suggest to apply a more refined binning to observe it, at least 1/4 of the beam size.
Also, I cannot find the .flair or the .inp file of your simulation, but I made a couple of trials with a very simple geometry. Please double check whether the beam size you are referring to is correct, since I have the suspect that is the main contributor to the discrepancy you are getting.
In particular, it might be that the beam size in the plot is already σx.

Cheers,
Daniele

To clarify the concept in easier words, it is fundamental to fully understand what happens during the 1D projection plot. What FLUKA is doing is to collect all the energy deposition within the inner and outer spacial coordinates you choose and average the same quantity over those.
You can find a delightful explanation here: https://indico.cern.ch/event/1012211/contributions/4247796/attachments/2257010/3829959/08_Scoring_I_2021_online.pdf

Applied to your case, since you are interested into a cylindrical mesh, the 1D projection plot collects all the energy deposition between 0 and 1 mm (radially) and it divides this quantity by the area your extremes enclose (π*0.01 cm^2) and by the coordinate binning you are projecting over (dz=4 cm).

So, if you want the longitudinal energy deposition in your geometry, you take the 1D projection along z from r=0 until r=R directly from the results. Then, you multiply the quantity by π*R^2 (the transversal mesh area enclosed) to get the energy deposition per unit length. You can do that just modifying the normalization constant.

The problem I was mentioning in the peak power density is indeed that this operation might cause an underestimation of the actual peak. With the current binning you are choosing, a suitable option could either be to adopt the 1D max plot or to apply the 1D projection to very small radii (rule of thumb: lower than 1/4 of the beam size). If you could provide the input file I’m sure we could provide better help.

Cheers,
Daniele

1 Like

Dear Daniele, thank you for your reply and sorry that the .flair was missing. The .flair is provided now.
ILC.flair (1.9 KB)
ILC.inp (1.1 KB)

For the first question, as you mentioned that the energy deposition peak strongly depends on the beam size. I followed your suggestion and applied a refined binning of 0.01cm, but the results was larger and still mismatched with that of ILC. Also the presentation material of ILC is provided and I simulated the energy deposition density as shown in slide 7, which is Aluminum alloy, 5GeV, 3.2nC, beam size 1mm.
Design of other beam dumps.pdf (3.0 MB)

For the second question, it seems that the longitudinal energy deposition may not simply multiplying the energy deposition density by the cross sectional area of detector. As you can see that the location of peak energy deposition density shown in slide 7 is not the same with that of the longitudinal energy deposition shown in slide 10, which is z=14cm and z=35cm, respectively. And I also found a report of Layout Considerations on the 25GeV / 300kW Beam Dump of the XFEL Project , as attached. During the report, you can see from table 4 (page 9) and paragraph 4 of page 65 that these two location may well be different.
Layout_Considerations_on_the_25GeV_300kW_Beam_Dump.pdf (1.0 MB)

And I want to ask another question if you are convenient. Do you know how to show the shower spread along beam axis by FLUKA, as similar as shown in slide 11 in the ILC presentation.

Thank you for your kindly help.

Hello Jia,

After checking your simulation, I immediately noticed that you are chosing an annular beam. In this case the sampling is uniform between the minimum and the maximum radii provided. This is indeed not correct and causes an overestimation of the energy deposition peak.
To simulate the correct beam, you must choose a gaussian profile.

Peak_longitudinal_dep

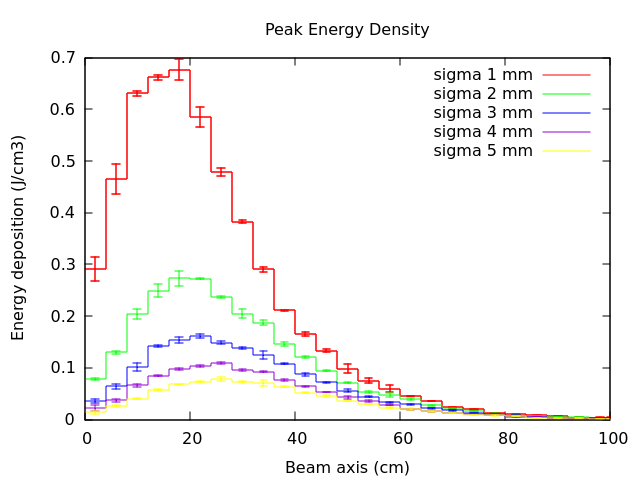
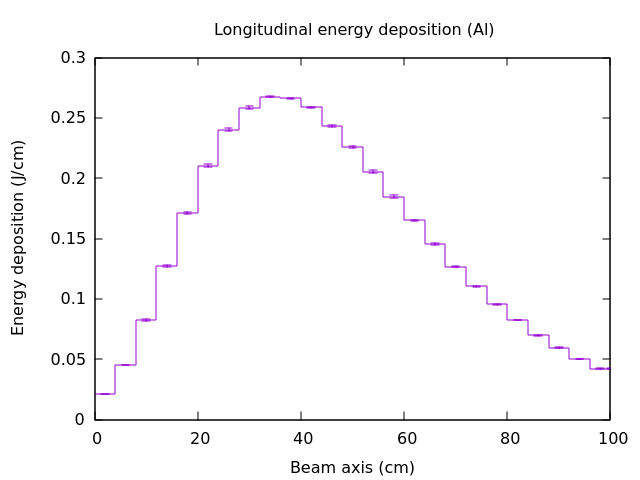
For what concerns the second question, the different peak in the longitudinal distribution is just due to the fact that the showers spread inside of the material. So, lot of energy is deposited further away from r=0 and do not contribute to the maximum energy density. That’s why you need to check for the two energy distributions separately (i.e. projecting along different radii).
In other words: when you look for the energy density peak, you should project along very small radii to observe the true peak. On the contrary, when you are checking for the longitudinal energy distribution you should do the opposite, to collect most of the deposited energy.

Longitudinal_energy_deposition

For what concerns the third question, I see already a dedicated discussion in the forum and I will keep the matters separated.
Here it is my input file. The emf-cuts applied are very rough to speed up the simulation. If you want a precise result, you should modify them accordingly.
ILC_dcalzola.flair (5.4 KB)
Let me know in case of doubts.
Cheers,
Daniele

Thank you Daniele. I think that I understand more about the concept of Longitudinal Power after reading your detail explaination. Thank you for your help again. About the third question, though a dedicated topic is there in the forum, it seems no one want to say something about it, which actually I am also confused. Could you provide some guideline about that topic?

Thank you very much.

Hello Jia,

No worries, it is a pleasure.
For what concerns the other topic, we are already working on that. As soon as we come up with a satisfactory explanation, we will directly reply there.

Cheers,
Daniele