Pulse height spectrum of CeBr3 detector

Dear all,

I am trying to simulate energy deposition inside CeBr3 scintillator. In future I would like to simulate pulse height spectrum of the detector. For first tests I placed radio isotope (137Cs) in front of scintillation material covered by approx. 0.05 mm layer of aluminium and I used card DETECT for scoring of deposited energy inside crystal. Obtain data were afterwards convolve with gaussian kernel to mimic energy resolution of a detector. 662 keV gamma peak ad 32 keV X-ray peak are observed in a spectrum, but I am missing backscattering peak around 182 keV, which is clearly seen, when we are doing calibration of a real detector with radioactive source.

With help of EMFCUT the transport and production of photons and electrons is set o 1 keV.

Do you have any ideas, what is behind this discrepancy?

Thank a lot for your help!

Raw data from simulation (DETECT):
raw_data

Raw data after convolution:
convolution_data

Spectrogram from experiment:
Cebr3_spectrum_experimental naive_detector.inp (2.8 KB)

Dear Jaroslav,

Thanks for this interesting problem!

Let’s focus on the 662-keV photons emitted from the source, which are the relevant players here.

Looking at their Compton-scattering kinematics, you’d indeed expect backward-emitted Compton photons to have ~182 keV, like you witness experimentally.

Two observations:

  1. Simulation-wise, as your source and geometry definitions stand, if you look with a USRBDX scoring at the (one-way) fluence of:
  • photons going from your detector region (CRYSTAL) to the housing (COVER)
  • photons going from your housing region (COVER) out (VAC)

you’ll indeed see the 182-keV onset (and in turn the 106-keV Compton backscattering onset from these 182-keV…, respectively indicated by the thick black lines):

So these near-182-keV photons are indeed produced in the detector/housing, but a fraction of them manifestly manage to escape.

  1. Looking at the deposited-energy / pulse-height spectrum with the DETECT card with “high” statistics (still not high enough…), you see an ever so mild hint that the 182-keV onset feature might be there (exaggerated scale deliberately chosen to highlight this otherwise very faint feature), but it’s essentially washed out in the background:

The latter two observations reveal that these near-182-keV photons produced by 662-keV photons undergoing Compton scattering in the detector/housing do not always lead to energy deposition in the detector: some escape, and those that manage to deposit their energy lead to a spectral feature that’s rather washed out in the background.

One is then led to believe that the ~182-keV feature you experimentally measure might have other contributions. (Part of) the culprit appears to be the fact that your simulated radiation source is essentially a point source in vacuum (for the present purposes air is essentially vacuum). Note that photons emitted in a direction pointing away from your detector simply leave the geometry.

Consider instead what would happen if you modeled more faithfully the source you have in the lab. It is not a point source (as in your simulation): instead it extends over a certain material volume and it is furthermore enclosed in some container/capsule (i.e. there are further materials surrounding the source).

In this new scenario, consider what would happen to a 662-keV photon emitted, say, along the negative z axis (away from the detector). Whereas before it would just exit the geometry, now it has the chance to undergo a large-angle Compton event (not in the detector, but in the volumetric radioactive sample itself or somewhere in the container/capsule), whereupon a ~182-keV photon would be emitted back towards the detector. Thus, not only 662-keV photons enter the detector: there’s now an additional net influx of near-182-keV photons (!).

I ran a crude preliminary test as a mere proof of concept:

  • using a volumetric source (you’ll need an additional BEAMPOS card with, e.g., SDUM=CYLI-VOL, cross-check in the manual).
  • assigning CESIUM to the DET1 region surrounding the source and ideally adapt to make sure that it encompasses the volumetric source. I put a few mm spatial extent, which is probably even too conservative (so the effect below might magnify if more realistic dimensions are chosen, and probably even further if the source capsule/container is added).

In such a scenario one sees the 182-keV feature start to pick up intensity in the energy-deposition spectrum:

Of course, the presence of the additional mass (volumetric source, and later when you add a capsule) also “Compton-scatters away” some of the 662-keV forward photons going into the detector, hence the drop in the deposited energy in the plot.

Anything else that enhances Compton backscattering will help. In particular, in your geometry you are missing the photomultiplier tube after your scintillator. If you add it in your geometry, you’ll have more material after the detector, giving 662-keV photons further opportunities to “Compton-backscatter”.

That’s as far as I got. It looks like at the very least you’ll have to refine the modelling of your source, container/capsule, and anything immediately after the detector.

Enjoy!

Cesc

PS: cheers to @vasilis who contributed to this initial digestion of the problem!

2 Likes

Dear Cesc,

first of all I would like to thank you for your reply.

I will implement cylindrical volumetric source with plastic capsule as you suggested. So far I have naive idea, that photons can undergo Compton scattering just in a detector volume and didn’t take into account source and surroundings. To narrow thinking about problem . . .

Do I understand well, that in case of volumetric source generated particles (electrons, photons) “see” atoms of radionuclide? If not, I probably missed your point.

Thanks again.

With regards,

Jaroslav

Yes, they are affected by the presence of the radioactive material and the container material (which are made up of atoms).

Best
Francesco

Dear Francesco,

I came back to share my results. I implemented 3 following changes:

  1. volumetric source
  2. capsule around radioactive sample
  3. window at the end of scintillation crystal

geom

I run 3 simulation with 30e6 primaries:

VOL - only volumetric source implemented
VOL + CAP - vol. source and capsule around rad. material
VOL + CAP + WIN - vol. source, capsule and window

And the results can be seen at these three pictures

compton_points

compton_line

convolved

Indeed desired effect can be seen :slight_smile:. I will see, how it will match experimental results.

In spectra new lines appeared, is it connected for example with material composition (for example characteristic radiation) or this is result of geometry? I tried to look at characteristic radiation of involved materials, but I didn’t find similarities . . .

I would have also one question about USRBDX. I used it to score particles from REGION1 to REGION2 and from REGION2 to REGION1, but it gave me same results. Is it even possible to resolve particles in this way with this scoring?

Thanks a lot.

With regards,

Jaroslav
volumetric_real_rad_win.flair (7.3 KB)

Dear Jaroslav,

My apologies for the delay.

Indeed desired effect can be seen

Excellent! We’re glad it worked.

In spectra new lines appeared,

It was not clear to me from your plots which were the new lines that suddenly appeared, so I reran the input you provided in the first and the last post. Here’s the plot of the DETECT pulse height spectrum I get with halfway decent statistics:

deposited_energy_crystal

Very nice Compton backscatter peak/bump by the way :wink:

Which new lines did you mean?

I would have also one question about USRBDX. I used it to score particles from REGION1 to REGION2 and from REGION2 to REGION1

No you didn’t:

You’re scoring two-way fluence across the boundary. You meant to select one-way (ϕ1) fluence.

Enjoy!

Cesc

Dear Francesco,

thank you for your support.

I don’t understand to occurrence of these lines:

capture_mod

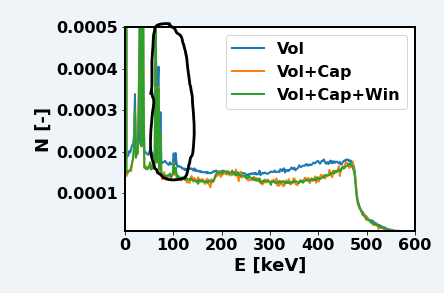
They were not present in previous runs and I am not sure, what is the mechanism. Of course, it is not a big issue, because they disappear after convolution.

I am sorry about question with USRDBX. I missed one parameter.

Thank you.

With regards,

Jarda

Dear Jaroslav et al,

My apologies for not having gotten back to this, which came back instead in the form of this new forum post reply: Scoring energy spectrum Cs-137 in LaBr3 - #4 by cesc

Cheers,

Cesc

1 Like