Dear Dalini,
here is an example:
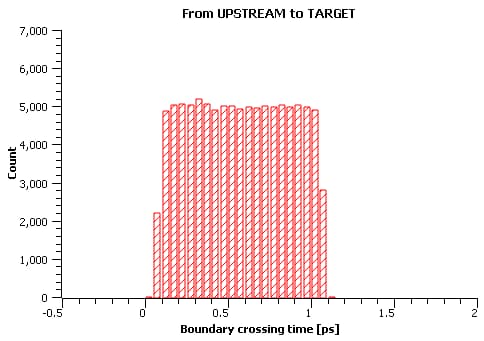
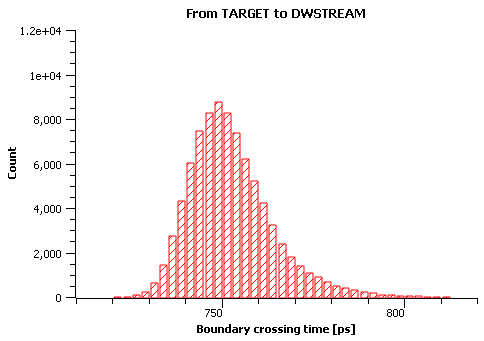
100 MeV protons are impinging on a 7.5 cm thick water phantom. The proton beam is 1 ps long. We score the time when the protons enter and exit the phantom. Then the scored times are plotted in a histogram.
Protons entering the phantom:
Protons exiting the phantom (in the 2 cm radius from the beam axis):
tof.flair (2.1 KB)
tof_source.f (18.8 KB)
tof_mgdraw.f (4.0 KB)
Cheers,
David
P.S.: The boundary crossing time can be scored with USRYIELD as well. However it takes some effort to determine minimum and maximum time without accessing the actual crossing times using the mgdraw.f user routine. Furthermore, in case you need to change the histogram, the whole simulation needs to be rerun.