Hello everyone,
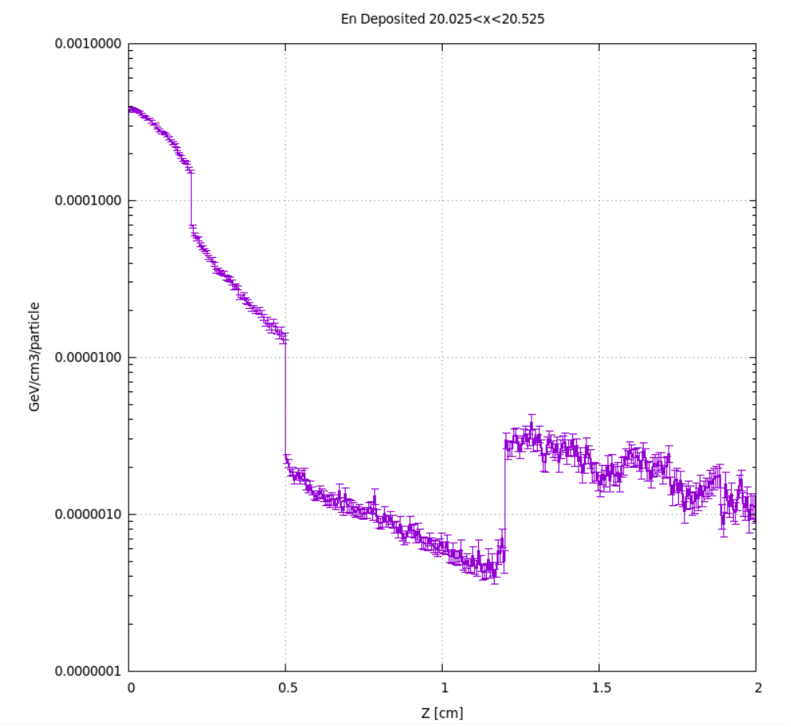
I need to plot the cumulative of the energy deposition plot and compare two different graphs.
I don’t know if Fluka is able to plot the cumulative, so I was thinking of using the source file of the energy deposition plot and write a script on MATLAB with the file data. Is this procedure possible? If yes how can I extract the data file of the USRBIN plot.
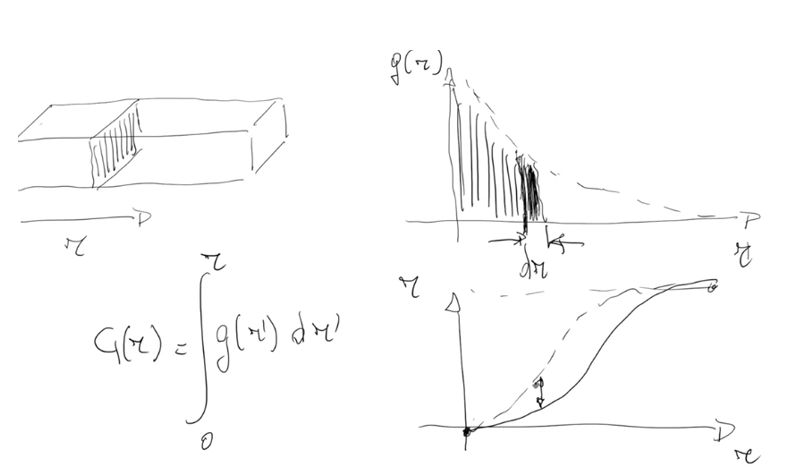
I have attached the plot and a sketch of the cumulative
Thank you,
Lovepreet Singh
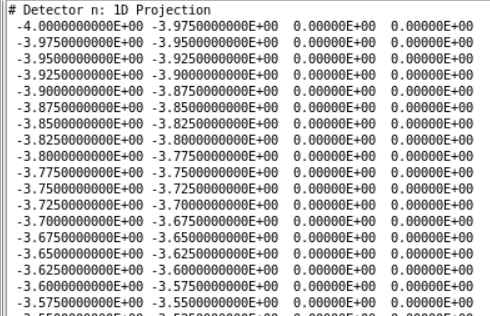
Flair automatically generates a .dat file of the content of 1-D projections in ASCII format. Look for that file in your run folder.
It is in general possible to convert a data file into a text (ASCII) file using Flair, but this is obviously a more complicated option. In the “Run” tab, open the “Files” panel. Then select a run and go to the “data” section. This will show data files which contain plots if you already created them. Select the file that you wish to convert then click the “->Ascii” button on top. A .lis file will be created which you can parse using a script. Again, I recommend using the .dat file if it exists instead of manually generated an ASCII data file.
There’s currently no Fluka utility that can generate cumulative plots.
Thank you Sir.
I have 4 columns of data in the dat file. How can I know what is the information contained in every column?
Lovepreet
The first two columns are the limits of the bin, the third is the bin content and the fourth is the relative error in percents.
Thank you Sir.
So, this data can be used to plot the 1D projection of energy deposition using MATLAB?
Indeed if you use the content of the third column to make a plot, using MATLAB for example, you will get back the 1D projection. To obtain the integral at bin N, aiming to calculate the cumulative function, you will have to sum the bin contents from bin 1 to N.
I got my answer.
Thanks