I was wondering how uncertainty is determined for differential fluence measurements given by the USRTRACK card. Looking at the .lis files output from processing the .fort files given by the USRTRACK card, for each bin there is 4 numbers, upper and lower bin edge, differential fluence in that bin, and a value that I assume to be the uncertainty, that is either zero if fluence in the bin is zero, or 99.0000 for any other value. I assume that value to be uncertainty, because when I use those files to plot in the built-in GNUplot interface in Flair, there are error bars on each data point. Any insight into how either the error bars are implemented in GNUplot or what that value 99.0000 means as given in the .lis file
what you understood is correct. For a given detector, each line in the *tab.lis file contains the lower and upper energy (GeV) of the bin, the differential fluence (1/(GeV cm2) if correct normalization was given in the input file) and the relative error on the estimated quantity expressed in %.
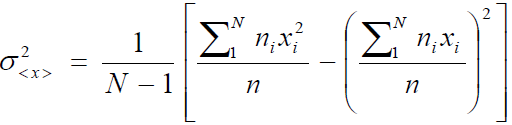
Given N cycles and n_i primaries per cycle the variance of the scored observable is evaluated as:
where n is the total number of primaries and x_i the average for one cycle.
The reason why you get 99% is either because you have simulated just one cycle and FLUKA cannot evaluate the above expression and returns 99%, or you have too few primaries or the phase space region covered by your detector is only slightly affected.
Try to ensure that you have 5-10 cycles of comparable size and merge the results. It is wise to examine how convergence is attained verifying that that error bars drop approximately with 1/sqrt(n).
Please try it out and let me know if you have further questions.
Cheers,
Davide
Just for clarification, is the normalization dependent on the area specified by WHAT(5)? I recently realized that I had input the wrong volume for my detector, and as such may need to re-normalize my data.
yes, in WHAT(5) you should enter the volume of the scoring region: FLUKA divides the scored quantity by this number. When you plot the spectra with Flair in a USR-1D plot, you can enter the re-normalization in the Y-Norm field: for your case it would be wrong_volume/correct_volume.