Hallo Xiong Bangping,
I start with #2 first because that is easy. #1 requires a little more explanation.
Question #2: Simply use the “^” symbol. For example, the following ^{4}He Energy Deposition at ^{6}LiF will give you the superscripts. If you want subscripts in the future, then you may use the “_” symbol. I use {} here because if you have multiple characters that need to be super- or subscripted, then you will need to include them all in the brackets.
Question #1: This is potentially more involved. Let us start with this original plot below:
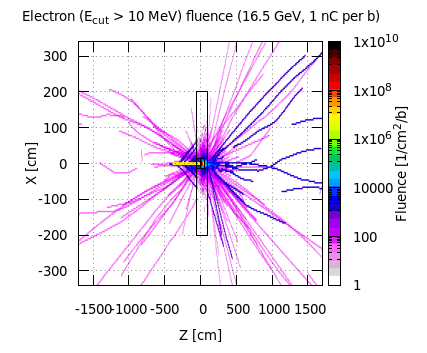
Let us say I want to turn the centimeters on the X- and Y-axis (which is the normal flair output) to meters. There are two options that I know of and use:
A) Quick way is to manually replace your xtics and ytics with the following commands in the “whitespace” provided in the flair interface.
set xtics ("-15" -1500, “-10” -1000, “-5” -500, “0” 0, “5” 500, “10” 1000, “15” 1500)
set ytics ("-3" -300, “-2” -200, “-1” -100, “0” 0, “1” 100, “2” 200, “3” 300)
B) Now I try to explain the more involved method in the following screenshot. There is a button in the bottom right of the flair interface that let’s you directly see what gnuplot commands are issued to generate your plot. You may then copy-paste the commands directly into a text file (e.g., with extension .gp). Now you may manipulate the plotting commands as freely as you want!

To obtain a similar result as step A, you can divide the XY axes values in the splot line by a factor of 100. Notice the difference that 1:2 in the original commands should now be ($1/100):($2/100). The whole line would then be something like this:
splot ‘bin_FluZX-ele.dat’ us ($1/100):($2/100):(6240000000.0*($3)) notitle ,‘bin_FluZX-ele.geo.dat’ ind 0 us ($5/100):($3/100):(0.) w l ls 1 notit
Finally in units of meters…
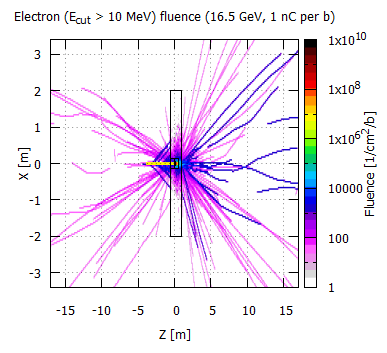
Just remember to adjust the XY ranges of your axes and the units of the XY labels, and you are all set! You may apply these ideas to your own plot to obtain what you want. 
Cheers!
Ted