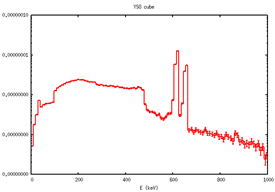
I am trying to simulate scintillator response to Am-241, Cs-137 and Ba-133. But in the spectrum extra peaks appears. Eg. for Cs-137 photopeak should be at 661.7 keV and x-ray peak at 32keV. But two peak appears between 660-660 keV.
Same with the Am-241, there maybe 3 peaks possible 20kev below 2 peaks and 59.5 keV photo peak but several other peaks appearing.
if you want to understand what is happening in your simulation I would recommend that you first look at the real (unperturbed) source term that is emitted. So I would suggest that you remove all geometric objects around your source by setting all surrounding materials to vacuum. When you then score the emitted lines you should see the real source spectrum. This is what you should be comparing against.
What concerns the gamma lines of Am-241 you will find 102 lines in the ENDF/B-VII.1 library. While it is true that most of them have a very low probability, they are still emitted and thus, I am not surprised to see additional peaks in your spectrum.
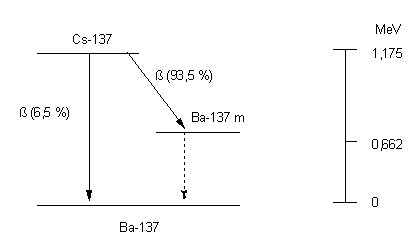
for Cs-137 it is not because of the library. Actually for Cs-137 sources you get the gammas via the decay of Ba-137m and that should give you the well known 661 keV. Then you have lines at about 31,8 and 32.2 keV with already much lower intensity + a bunch of even less visible ones between 4.4 and 37 keV.
In principle you could also simulate in air but with this you already provide a potential scattering partner.
In general, if you want to check what is happening in your simulations then I suggest to get rid of anything that can impact your results, and then systematically bring back the respective parameters one by one.
Many thanks, I understand that peaks are possible at 32 keV x-ray photopeak from decaying to 137Ba , 85 keV x-ray peak from decaying to Pbkα,β, backscatter peak around 200 keV, Compton edge. I am curious about the peak around 620keV ?
I tried using vacuum, still gets two peaks around 620 and 662 keV. any reason for that?
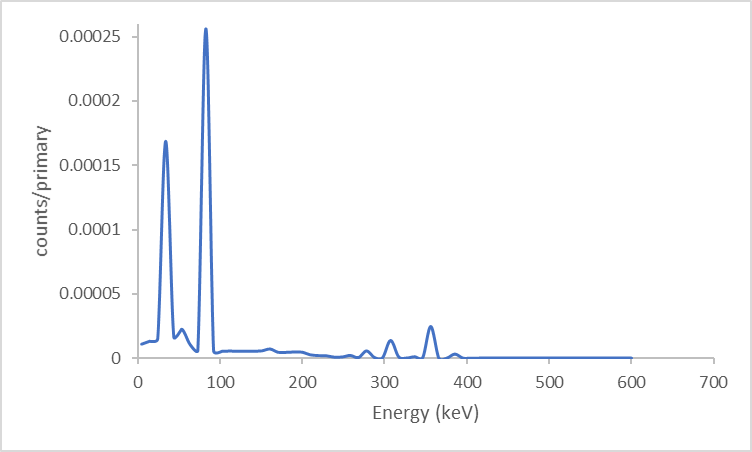
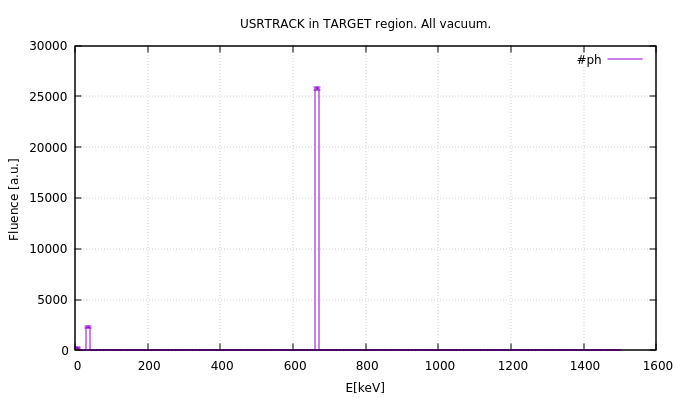
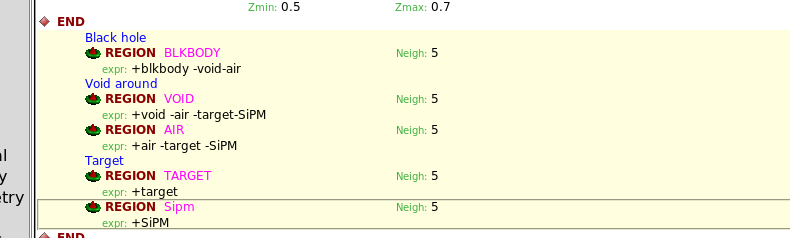
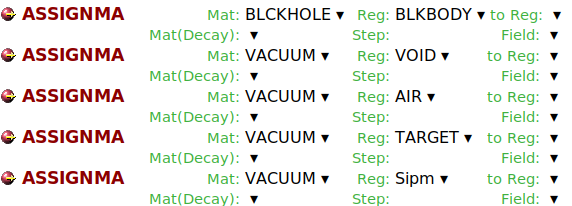
You did not set all your regions to vacuum as suggested by @ctheis, in fact you did not set any of them to vacuum. Please set vacuum as the material of your Sipm, TARGET and AIR regions and run again your calculations, you will find that there are only two types of photons produced with significant intensity: 32 keV and 662 keV. Below the result of an USRTRACK scoring in your TARGET region. By the way, your source is very far from the detector and therefore you need to run many primaries to get good statistics, maybe to perform your tests faster you could move your source closer so you do not spend so much time sampling photons whose trajectory will never intercept your detector.
Once you see this you may want to start including the different materials of your geometry one by one and see if the peaks you were reporting appear again. Please let us know if there is something weird.
Not sure what do you mean. You don’t need to change anything in the region definition, you only need to set the material that is filling them to vacuum. See screenshot below: