Dear FLUKA experts, I wanted to know the relationship between the Average Uncertainty (sigma) and the Total Primaries Simulated (NPS).
SO I ran five cycles of the example treated in the FLUKA manual with NPS 600k. I then calculated the average uncertainty of the spectral fluence using the “tab.lis” data which resulted to about 42.7 %
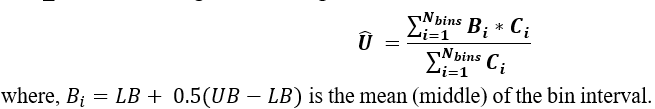
I used the following formula:
From the “sum.lis”, the NPS = 600k*5 = 3,000,000.
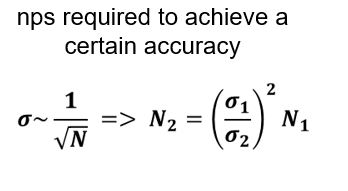
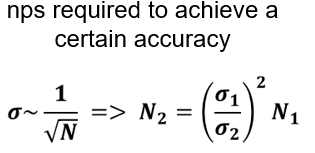
Assuming that uncertainty varies inversely with the square root of NPS, I used the following relation the compute the new NPS needed to get an uncertainty less than 10%. Even after rounding up NPS to the next 100k ( = about 1.4M), I still got sigma = 12.1 %.
Question(s).
I don’t understand why this is the case. Are my relations flawed?
How can I get this to work?
as it is shown in the Monte Carlo Basics presentation, the statistical uncertainty of Monte Carlo’s estimations decreases with the number of contributions N as 1/sqrt(N). I suggest to have a deep look into the presentation.
Looking at the formula you use to calculate what you call the average uncertainty, I miss to understand which bin you are considering. In any case, I would rather consider the uncertainty of the result for a single energy bin or the error of the sum value, given in the *_sum.lis file. Looking at them, you will see the expected proportionality to ~1/sqrt(N) while increasing the number of primaries (N) of your simulation.
Thank you for your response. I apologize that I gave you a wrong formula but to clarify,
I considered all the bins in the *_tab.lis data and taking the weighted sum of the percentage errors (Counts_i * error_i) and then dividing by the sum of counts as shown. I believe this is the weighted sum of the percentage errors? Which I call the average uncertainty.
For instance, a simulation where I set NPS = 600k in the input file and ran 5 cycles, I got this from my calculations:
Average Uncertainty (U_1) = 42.7305
Total Primaries Run (N_1) = 3000000
But with NPS = 55000000 in the files and still running 5 cycIes, I get this
Average Uncertainty (U_2)= 12.1090
Total Primaries Run (N_2) = 275000000
AND this:
N_2/N_1 = 91.67
(U_1/U_2)^2 = 12.45
Even the Values from the *sum.lis for the Total response do Not follow this relationship as shown
N_1 = 3000000
sigma_1 = 0.2291394 #%
N_2 = 275000000
sigma_2 = 5.9575517E-02 #%
N_2 /N_1 = 91.67
(sigma_1/sigma_2)^2 = 14.79
The reason for doing this that I wish to use the uncertainty and NPS from the first simulation ( a few primaries) to determine the NPS that will result to an uncertainty less that a certain value. That is, if my target average uncertainty (U2) is to be less than 10%, then I need to have
N2 > N1*((U1/U2)^2). So, even after rounding up NPS to the next 100k, I still got sigma = 12.1 %
I see mainly three points in the mechanism you want to establish, all based on the fact that Monte Carlo is based on random numbers:
Increasing the number of primaries in your run, you could also open rare reaction which did not happen in the previous run with less primaries. I guess you are taking this into account with the weighted average, where I am guessing that the Counts are actually the result of the estimator, so the third column in the *tab.lis file. In any case, this could still create some differences, particularly if you plan to start from simulation with few primaries.
As written in slide 30, the variance itself is a random variable. Runs with the same
number of primaries but different random seeds will give different values of the
variance.
Additionally, I wonder how meaningful is to consider the average uncertainty to establish if your simulation results are reliable. You could get still some result with high uncertainty (isolated spikes) but you would not see them averaging. In this sense, it would be better to check the error of the specific bin you are interested in, or to look at the error of any bin.
Thank you very much for these clarifications:). Your points 1 & 2 clearly explains my doubt and exactly what I needed.
To address your point 3, why I used the average (weighted uncertainty from the *tab.lis file,
I’m more interested in the overall reduction of the error bars when I plot the differential spectrum.
For example, Suppose that I have 1024 bins, how do I chose a single bin to judge the statistical accuracy of the overall result? Also, Since these errors are themselves random, I think that a single (randomly chosen bin) could present a large error (due to low counts in that bin) whereas the other bins will have lower errors. Correct?
This is why I multiplied every bin error with the corresponding counts (3rd column) x (4th column) computed the weighted average as shown in my formula.
This value thus decreases with the number of contributions N as 1/sqrt(N) N but I wasn’t sure why the relation N_2 /N_1 = (sigma1/sigm2)^2 was not being respected.
So, based on your explanation and notes from slide 30 of the presentation, I do not except N_2 /N_1 = (sigma1/sigm2)^2 to be exact except for very large N (–> infinity) where the calculated mean converges to the true values. Correct?
I understand your use of the average uncertainty, but at the same time I just wanted to warn for possible unexpected spikes/drop which still might show up in your simulation. Clearly you cannot simply rely on the 1/sqrt(N) behaviour to obtain statistically meaningful results. As recommended in the slides, plotting the final results can also help to check the convergence of the results.
I would assume that you can expect the 1/sqrt(N) trend for the each uncertainty of your bins (and therefore, also for the average uncertainty) only if the specific bin have received a sufficiently large number of contributions N, such that the Central Limit Theorem is valid.