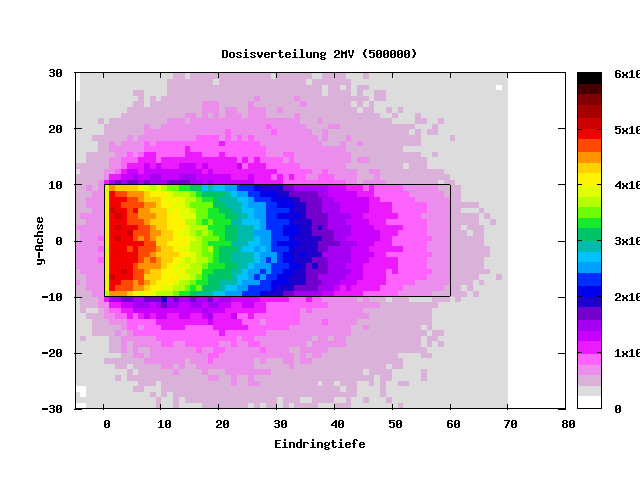
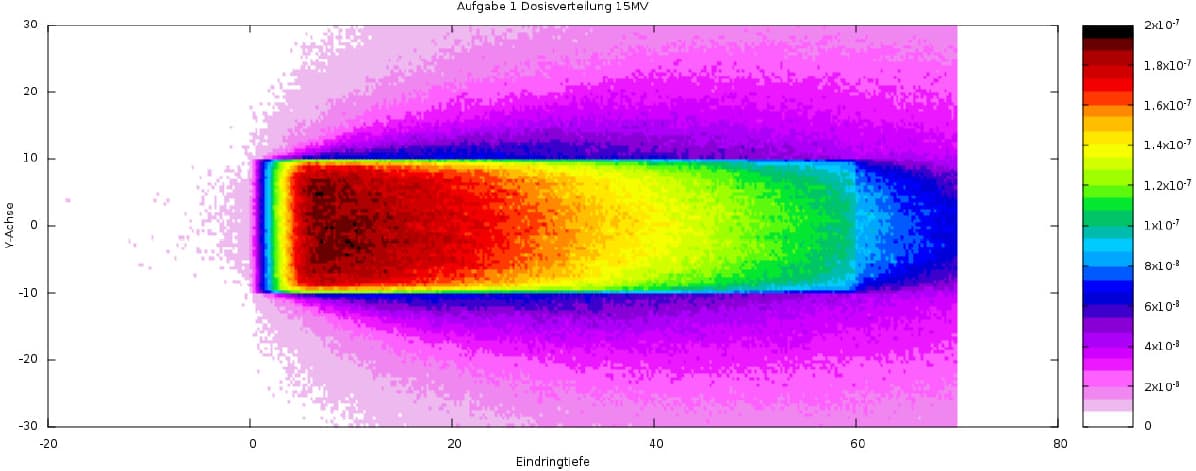
I would like to recreate a Fluka simulation. For this I got the .flair and the .inp file from my lecturer. But with the same settings my plot (figure 1) has a lower resolution than the given one (figure 2).
Is there any setting with which I can increase the resolution of the plot?
It seems to me that the two plots have been obtained using different binnings. In the top plot, I can count 20 bins along the y-axis, within the target. Instead, in the bottom plot, I can count about twice as many.
Also, the titles of the two plots seem to indicates that they are actually showing something different.
Dear @amario,
thank you for your reply.
Sorry for the different titles of the two plots. I renamed it so I wouldn’t get confused with my lecturer’s label. But the plots show the same issue.
Can you please tell me how to increase the binning number so I can get similar results?
To increase the number of bins in a given direction, you need to increase NX or NY or NZ in the USRBIN card. Also, if you want to obtain exactly the same results of your lecturer, you should also set the same minimum and maximum value for each of the three coordinates.
I recommend you to have a look at the manual for the USRBIN card and at the lecture on scoring from the last Fluka course.