This is my input file: dpaGEOCuCyl.inp (8.0 KB)
I am trying to reproduce the results from https://inspirehep.net/files/e7cc6515f72497910f33070f66d643a4
Beam area was 1 cm 2 and target geometry was cylinder with 5 cm radius
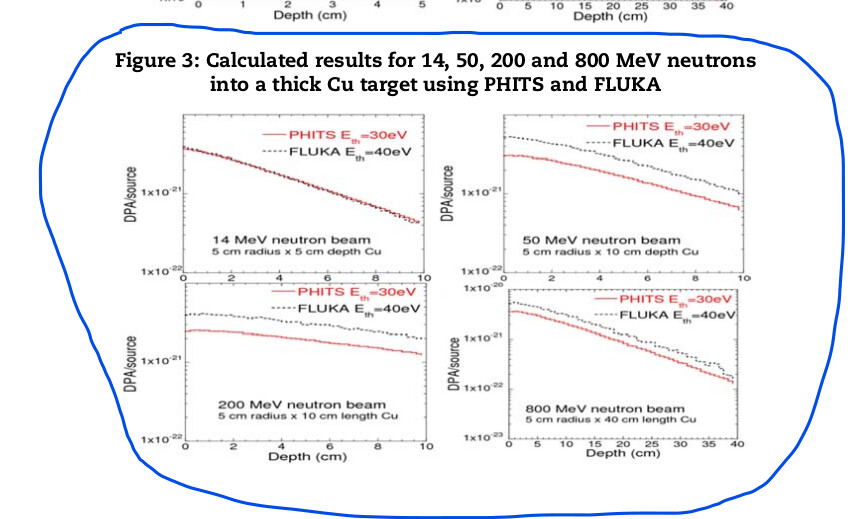
and each depth. All the calculated results were normalised by the number of incident particles. For this run, neutrons of 14 MeV are considered and 5 cm is the depth of the Cu target. I was trying to compare with the result given at Figure 3, top left, of the publication…
The results that I got are:
From dpaGEOCuCyl001_fort.73 where I score single region: 1.3149E-20 dpa /primary.
The publication shows:
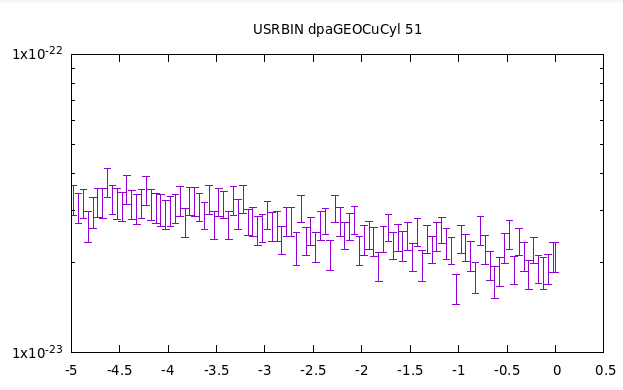
While from flair plots I have:
1 D projection in Z
and the same with cylind. binning.
There is a big difference on the FLUKA results…
Could you please have a look and let me know if there is a card in my input file that creates this huge underestimation in dpa or there is another way to produce the plot in order to draw such comparison?
Should I maybe multiply the small numbers I got with total number of atoms in the detector?
we can only provide support for the FLUKA (and Flair) version released by CERN (https://fluka.cern). Based on your input file, you are running a different version.
Please run your simulation with a FLUKA from CERN, and if the problem is still there, let us know.
Hi Georgios, perhaps another thing to check is if the values shown in the paper correspond to the peak dpa values. What you are plotting now is the profile along Z but with the values averaged along X and Y. If you did not restrict the plotting ranges to the center of the Cu target (where the beam impacts and the highest dpa values will be found) the results are averaged out with the bins further away from the center where the dpa will most probably be much lower. Try to plot again using “1D Max” to get the peak values, the results will then correspond to the maximum dpa values found in every XY slice for each Z coordinate.
Thanks so much Andreas!
I run again 10 times more statistics (100K events).
The total dpa is: 1.3072E-20
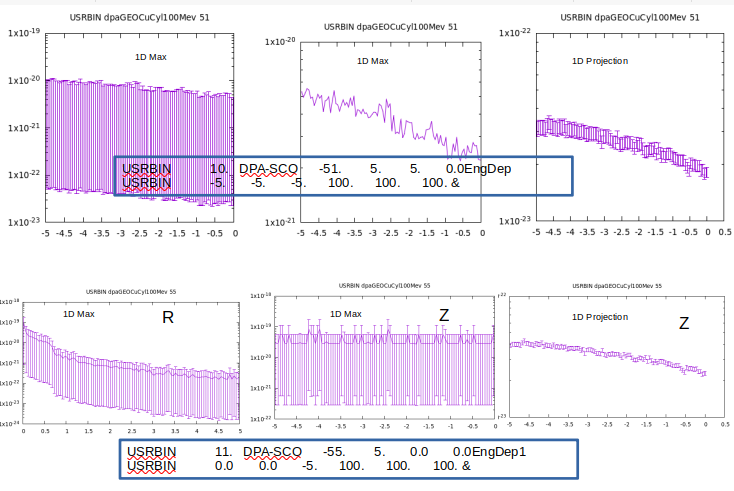
But still judging from the plots, there is still a big discrepancy. I chose to plot them as you suggested with 1D Max and compare also the cylindrical binning…
Do you think -judging from my input- I could count those results as correct?
Any additional help is highly appreciated…
Thanks for providing the plots and explanation. From having a look at your input file, the total dpa value you quote is indeed obtained by using a scoring over the entire target region and therefore does not differ much from before, using a very low-resolution type of binning.
For the more specific peak values you show in the plots you always have to be a bit careful with cylindrical binning results: depending on the angular resolution in the cylindrical binning, the bins at the center are very narrow slices and can result in not properly resolved values, certainly because the cylindrical mesh center is exactly where the beam impacts. The Cartesian mesh is in this case more intelligible since all bins have the same size. I am a bit confused as to what you are plotting on the top left vs. top middle? The error bars are still very large so you will need to collect more statistics to arrive closer to what is plotted in the paper. Also the plot titles say 100 MeV, the neutron beam energy for these plots is still 14 MeV, right? Cheers
I’d add that the result depends on the beam size and it’s not obvious to me that yours matches the one in the paper, which I failed to find. Also I’m not sure what you mean with total dpa: dpa is a density-like quantity and as such is not additive in the space (being an average over the considered volume). As Andreas @anwaets remarked, your cylindrical mesh, which is still recommendable for this case, has an excessive resolution. With a uniform beam spot of 1 cm ‘diameter’ (do not use CART-VOL for a not volumetric source, rather the dedicated BEAM card fields), there is no point in asking for 100 azimuthal bins, instead of 1 only.
Hi, thanks a lot for your remarks. I followed your suggestions as you could see at the attached input. dpa1test.inp (7.1 KB) In the picture I provide several plots but seems the values depend on the binning.
Its not too clear what is the correct approach to be able to compare with the publication I listed efore named “Development of displacement damage model in PHITS and comparison with other codes in a high-energy region”
It is stated in that paper: Beam area was 1cm^2 and target geometry was cylinder with 5 cm radius and each depth. All the calculated results were normalised by the number of incident particles. I am a little puzzled how to reproduce their result.
From the event-by-event using Eventbin can we have any useful information?
In addition: DPA of 1 x E-20 means that 1 atom of a sample of
E-20 atoms was displaced from its lattice site.
To obtain the number of displaced atoms from the DPA value
per primary one has to multiply with the number of atoms in the
detector. According to Avogadro’s theory the number of atoms for
this detector volume is: (3.14255*8.96/63.546)*6.022e+23 = 3.3327306e+25
Thus, Total DPA/primary = (3.3327306e+25) * (1.3149e-20) = 438220.75 / primary
Is it correct and how can be used to compare with?
I am really grateful for your suggestions.
Not really. You just need one USRBIN cylindrical mesh.
But nobody refers to the total number of displaced atoms (that is not DPA), rather to the number of Displacements Per Atom, which is what is reported in the paper and scored by FLUKA and does not require to be multiplied by the number of atoms in the detector.
See a highly simplified version of your input embedded in dpa1test.flair (1.5 KB) that gives a curve quantitatively matching the published one. Of course you can increase the statistics and further improve the curve smoothness. You will see that, considering the ± 5 mm beam spot, I averaged the scored DPA over a 3 mm radius, to consider an area homogeneously covered by the beam (evidently if one extends the averaging interval beyond 5 mm, the resulting DPA value will drop, as @anwaets anticipated, while the 1D Max profile suffers from statistical fluctuations until a sufficient statistics is achieved).