I am using neutron source of energy > 20 MeV that hits an iron sphere and thus a pointwise treatment that acconding to the manual, it could provide correct recoil information.
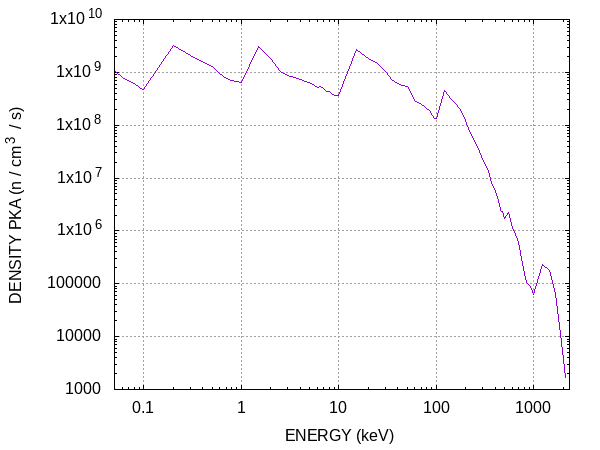
I would like to have [a primary knock-on atom (PKA ) spectra] the spectrum distribution of the instantaneous densities of atoms as a function of energy (in cm−3.s−1) like the plot below:
Could you please tell me what fluka estimator (card) I could use and how?
What about the option NEU-BALA? Does this provide all secondary neutrons as recoils? But what differential quantity need to be scored in order to have in the units expressed as keV / cm^3/s as the plot atttached?
I see two ways.
One of them is to enable nucleus transport with IONTRANS ( WHAT(1) = -2.0 ) and lower their transport threshold by setting the 4-HELIUM one (that applies to all heavier nuclei in terms of same energy per nucleon) at 1 keV (aka the lowest limit) by means of PART-THR. Then, for spectrum scoring purposes, you can use USRTRACK on a given region for HEAVYION (limited to Z>2) and get (with the division by the region volume) the nucleus differential fluence in 1/(cm^2 GeV) per neutron, becoming cm^-2 keV^-1 s^-1 via the neutron current normalization (and GeV to keV rescaling). However, this is not exactly what you ask for, since it includes the PKA transport after generation (hence the resulting fluence) and is cut on the lower side at few hundred eV per nucleon.
Note that an energy spectrum implies also /keV in the y axis units (except for lethargy representation) and that NEU-BALA has nothing to do here, since it refers to neutrons and not recoils.
The second way may reach your exact goal, but requires some coding of your own in mgdraw.f (USDRAW). For each interaction (ICODE = 100 or 101) - by > 20 MeV neutrons -, you can access the recoil energy (EKRES, after adding INCLUDE 'resnuc.inc' in the INCLUDE list at the top of the mgdraw.f file) and take note of it. At the end, you will know how many PKA have been produced in a given region for the number of simulated histories as well as their energies, therefore you could get the desired cm^-3 keV^-1 s^-1 PKA spectrum.
Note however that in both cases you will miss the contribution of PKA by < 20 MeV neutrons. This is instead included in the related (and much more straightforward) DPA-SCO scoring by USRBIN, providing the DPA 3D distribution.
Lets make a use of a fluka input where the target is an iron sphere and the neutron energy < 20 MeV and score the DPA. In that case from the DPA 3D distribution as you pointed out, how I could convert it to a pka density distribution?
In addition, if instead of using the iron as a target, we take the 6Li that has the pointwise treatment of neutrons and thus gives correct recoil information. Can I use both your ways you develop at your answer above in order to get pka spectra?
Dear Georgios, in your input, the PART-THR card applying to NEUTRON gets spoiled by its WHAT(6) = 1.0.
Technically yes, with a proper LITHIU-6 MATERIAL definition, and referring in USDRAW (mgdraw.f) to ICODE = 300 for < 20 MeV neutron induced reactions. However, in that case the “recoils” are such as 4-HELIUM and TRITON, and no longer HEAVYION, and they should be sought also in fheavy.inc and not only in resnuc.inc.
You can’t. The DPA spatial distribution is in fact the final result of the produced PKA spectrum (and includes the contribution of low energy neutron reactions, which comes from the low energy neutron library and not the explicit simulation of the reaction).
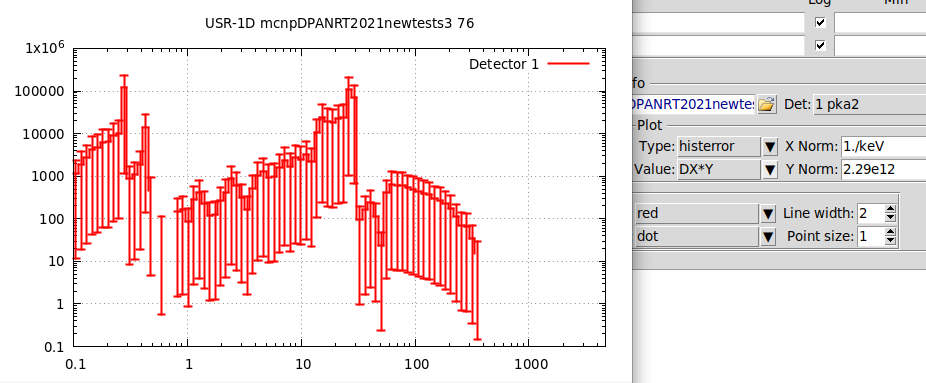
From FLAIR, I choose to plot the quantity: “DX*Y”, where Xnorm = 1/keV, and Ynorm = 2.29e12, associating this number with the neutron intensity [n/s] that corresponds to the neutron yield per unit of time (and not the operation time).
Is this approach reasonable? Since I need to have it expressed in density units / cm^3, is anything else I could do before trying the much more complicated 2nd method invoking the mgdraw scoring routine?
You don’t need to do anything: HEAVYION is essentially limited by construction to Z>2.
Note that if you take the USRTRACK course of action discussed above and indicate the volume of the sphere you’ll obtain a fluence spectrum. I.e., the raw units (before applying any conversion when plotting) will be 1/(cm^2*GeV*primary), not 1/(cm^3*GeV*primary) (!), where the dimensions of 1/length^2 come from dividing a tracklength by a volume.
Looks like the second route suggested above might be worth a shot.