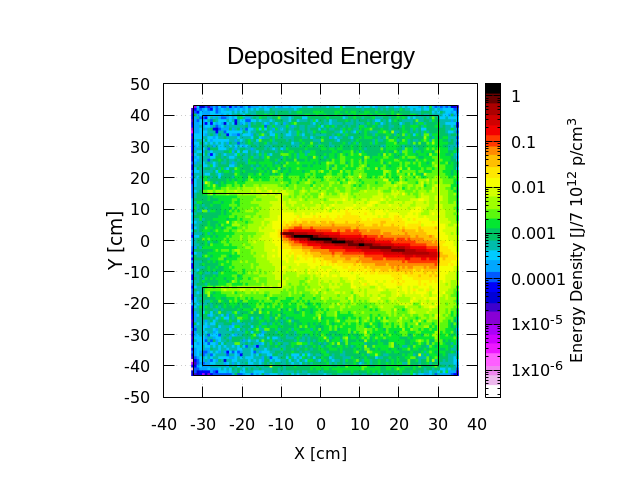
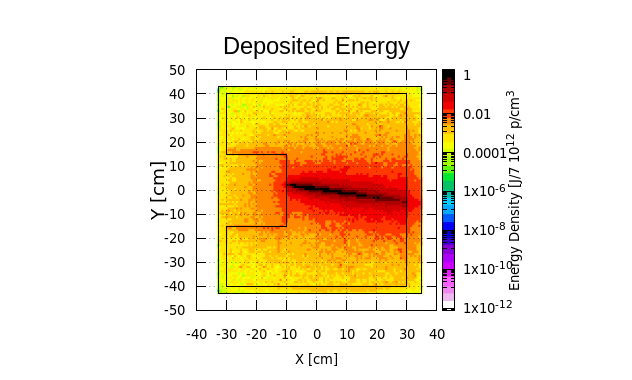
I have successfully installed the new Flair on Ubuntu 18.04 via the command line (v.3.0-4). I ran the tutorial noted on the CERN website (here) to check the installation, and found that the outputs are different despite my having not edited the file since I ran it previously to check the previous Ubuntu Flair release. Namely, the first file generated of deposited energy has a much narrower energy range, whereas the particle fluence appears unchanged. I include here the Flair file of the tutorial, as well as the old and new outputs for energy. Thank you kindly for your time.
Hi @rick
looking the two plots seem equivalent, its only a matter of color scale. Your plot starts from 1e-12 to 1 while the tutorial one starts from about ~1e-7
Please note that color plots are nice but not so informative compared to single differential plots.
You can plot with flair the trace of the maximum vs z, and/or the spread of the beam and compare the two plots one on top of the other to differences.
Hello @vasilis
Indeed a 1D trace does show the equivalence of the two plots. I am unsure why the color scale shifted, but am reassured that the new version produces the same outputs. Thank you kindly.
If the scale is not explicitly provided gnuplot uses an autoscale. The more events you run the more statistics you will get in low flux regions thus the scale will be broader.
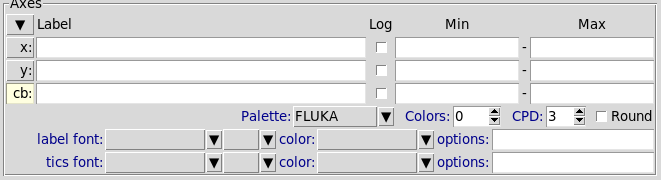
You can manuall define the scale (which is a good practice)
in the cb row of the axes Note that if you click the cb: button more options will open to further finetune the scale