Versions
Please provide the used software versions.
FLUKA: Latest
Flair: Latest
Description
Dear experts,
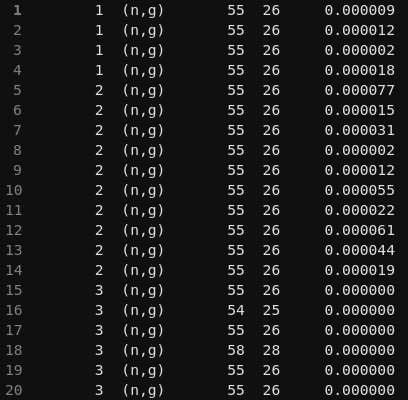
I am usingicode = 300andmgdraw.fto extract PKA, and I implemented reaction‑channel selection by inspecting light secondaries (from genstk.inc) and heavy fragments (from fheavy.inc) as suggested. FLUKA User Forum (How to separate pKa by reaction channel (n,p), (n,α)… in mgdraw.f?)However, my output only shows
(n,g)capture and not other channels like(n,p)or(n,α)etc even when I expect these to occur. Could you please clarify why only(n,g)is being identified and what conditions or common‑block variables I should check to correctly distinguish and capture all relevant reaction channels?Best regards,
files
PWR.inp (6.6 KB)
Source_NewGen_updated.f (18.9 KB)
pka.f (13.0 KB)
PWR_RPV.txt (5.8 KB)