Please see the attached images.
I am trying to produce the gamma spectra of Co60. But I am not getting the desired output.
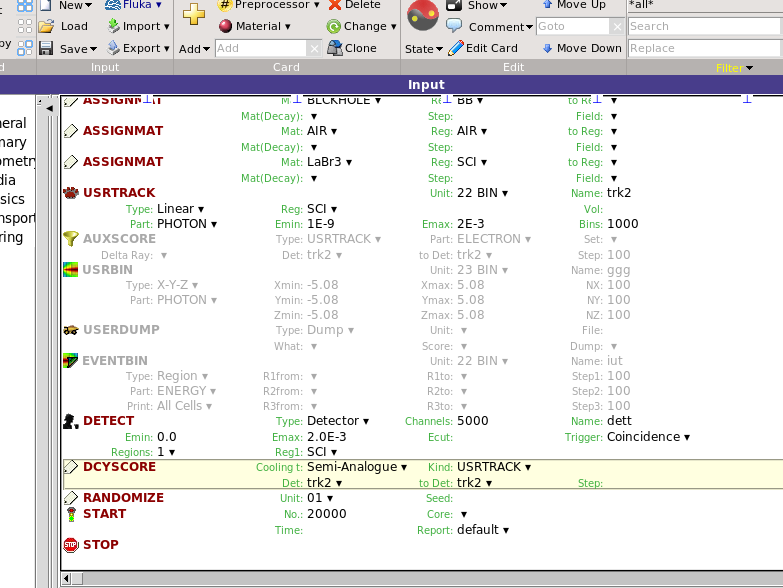
The x-axis of the plot is always from 0 to 1000. I tried changing all the parameters in
DETECT card, but it stays same. If x axis is channel number, why is it only till 1000.
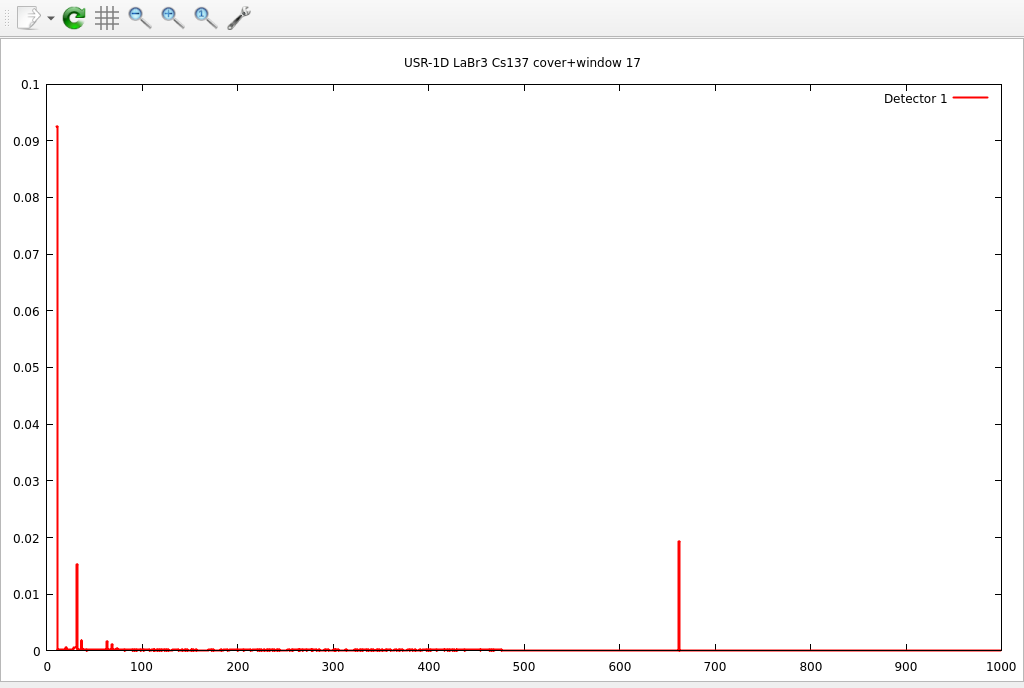
The plot is also incorrect. I can’t find two photo peaks correspond to 1173 and 1332. But USRTRACK plot is giving this. But I read DETECT card gives accurate detector response so
trying to use that.
I need to see the changes in spectrum, when I change the detector size. That’s my aim.
Dear @akshad997,
to have source size (self-shielding) effects you need also create a REGION with dimension corresponding to the 60Co source with cobalt (main isotope) material assigned.
May I ask you what is your purpose of using the DETECT card to set event trigger, what is the source of time-resolved event in your model? Typically use of this card hav range of limitation see: 7.22.15. DETECT — FLUKA Manual
Can you obtain the spectrum with the USRYIELD scoring without triggering events?
It will be useful for me to see setting of the plot to understand cut of of the USRTRACK card at 1000keV.