In neutron shielding design, I have appropriately separated the gamma-ray and neutron contribution to dose rate. I need to plot the total contribution, gamma-ray and neutron contribution to dose rate on one graph all together in 1D projection. I have no idea how I can do this. Any assistence please?
This could perhaps help.
Dear @Motlatsi_Vincent ,
you can overlay multiple 1D results in a single “USR-1D” plot by adding extra Detectors with the + sign indication in this figure:
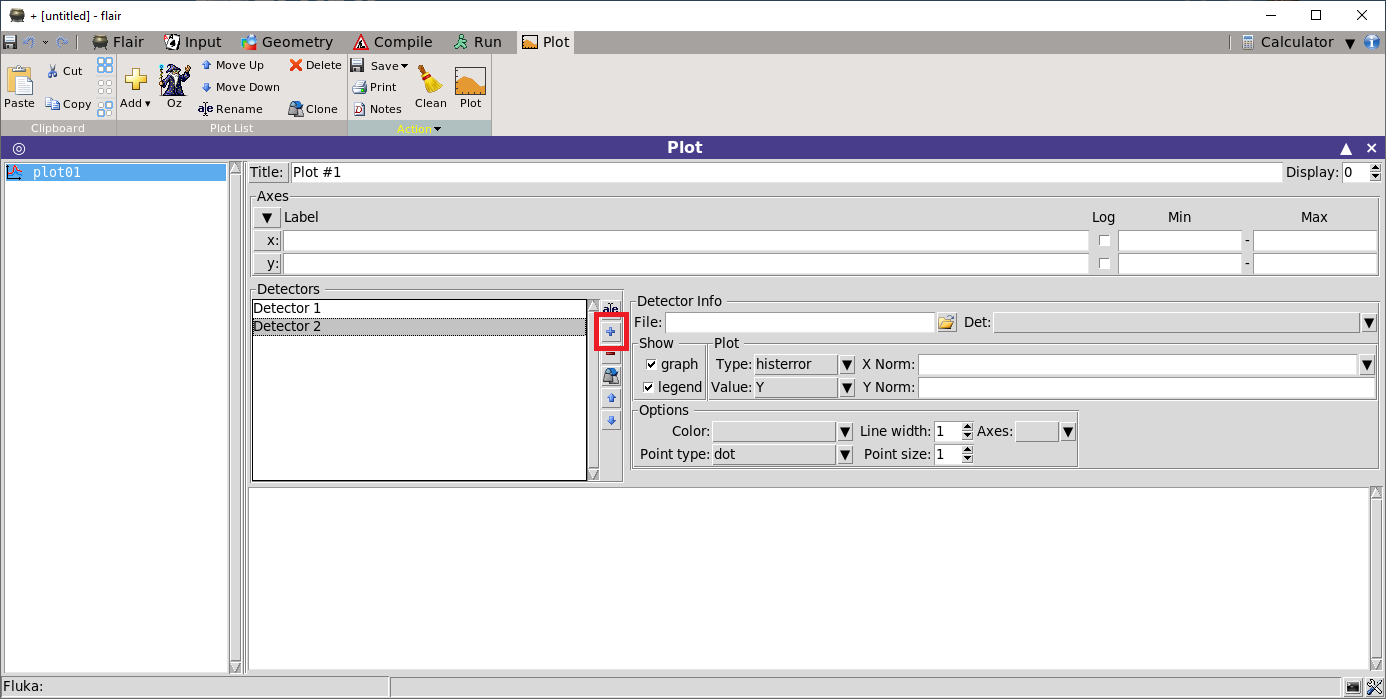
If you are used “USRBIN” plots with 1D projection, then the actual 1D plot values are saved in a .dat file using the filename of the plot. These files then can be used in a “USR-1D” plot.
Cheers,
David
Dear @Motlatsi_Vincent
I have attached a FLAIR file as an example. Run the ‘basictest’ input, process the photon and neutron data and plot them first, and then plot the sum files. Most of the commands in the sum tabs are copy pasted from the “show output” window of FLAIR.
If you are trying to plot the sum of two 1D estimators such as USRBDX or USRTRACK from the same fort file, then you need to add the data (from the *tab.lis files) in some fashion (easiest is a spreadsheet) before plotting it like a regular file. I have not tried that it in gnuplot, but it might be possible with the index option. If they are from different fort files, you can play with the file names in the Sum_1D tab of the attached FLAIR. Again, you can get very helpful hints from the FLAIR show output window. Also, keep in mind that the energy bins could very well be different and the addition may be meaningless.
Cheers, Sunil
basic.flair (4.3 KB)
2 Likes