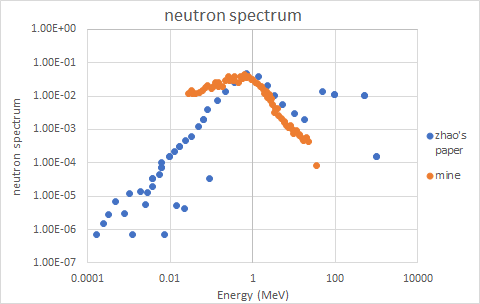
I am an undergraduate student majoring in mechanical engineer major. I am studying the ADS spallation process by following this paper “Application of FLUKA and OpenMC in coupled physics calculation of target and subcritical reactor for ADS”. After I got the neutron spectrum (I’m not sure, please correct me) and using webplotdigitizer to compare my result with the result from this paper the shape of my neutron spectrum look very different at 1e-4 to 1 MeV as attached in picture below. I don’t really understand about physic nuclear, I guess it is because of my density or something about materials that don’t match with the input of paper. I would appreciate if someone could tell me what happen with my neutron spectrum shape and how to fix it?
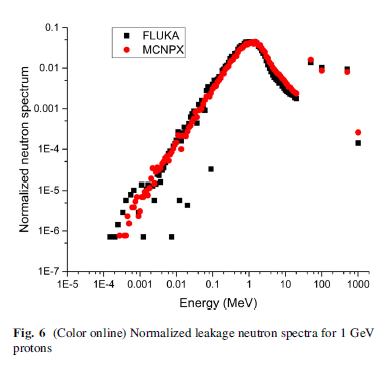
This is neutron spectrum form the papaer.
Web plot digitizer compare
Here is my flair and input that I was created and got the result. ads_zhao.flair (7.3 KB) ads_zhao.inp (5.9 KB)
First of all, some observations on your beam definition. You have defined a gaussian beam shape with a FWHM of 20 cm. Are you sure this is correct, given that the beam aperture itself has a radius of 20 cm? You have also defined an isotropic source, which does not seem realistic. In Table 2 of the paper you refer to, an annular beam with 10 cm radius and uniform spatial distribution is described. I have implemented this in the modified Flair project attached below.
It is also not clear to me which neutron spectrum you want to obtain. In the attached project I assumed that you want to look at the neutron spectrum inside the TARGET region (comparable to Fig. 4 in the paper), and the spectrum going from the TARGET region to the CORE (Fig. 5?). This can be accomplished with two scoring cards (USRTRACK and USRBDX respectively). There are many different scoring cards in your file, some of them duplicated; I have cleaned them up for clarity.
With this, I obtain spectra that look like the expected ones, but I do not have the data to make a detailed comparison. I would recommend that you run this file and check. Note that the apparent shape of the spectrum depends heavily on whether you plot Y or <X>*Y in Flair (the latter is correct in this case).
By the way, in your compound material definitions you seem to be calculating actual numbers of atoms; what is needed are simply the relative abundances. Your approach should not have an impact on the results if done correctly, but I suspect it may be time-consuming for you. See this lecture for a detailed explanation:
Furthermore, once you have added the material ZIRCONIU, this is already the natural composition so you don’t need to define and use the individual Zr isotopes (unless the natural composition is not what you want).