Fluka experts
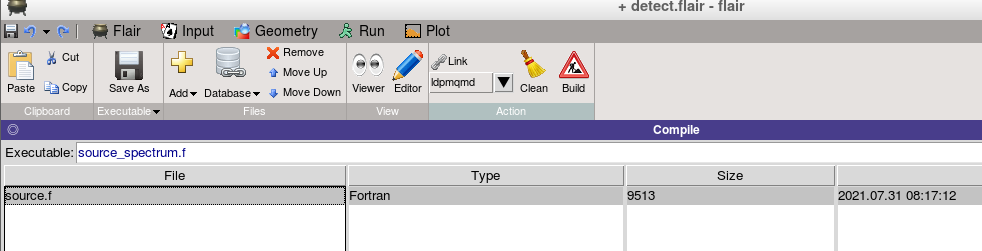
To define the source with the custom spectrum, I compiled source.f and executed the source_spectrum.f file that was sent to the attachment and entered the name of the custom spectrum in line 68, and then did the Build and the SOURCE card in I defined the code but the answer is no different from when the spectrum is not defined, please help me. Thank
detect.inp (2.0 KB)
source.f (9.3 KB)
source_spectrum.f (10.5 KB)
spectrum.txt (4.3 KB)
s
Dear Hassan,
To run your simulation, you must change the input file name in source_spectrum.f at line 68. Change mspectrum.dat for your actual file name: spectrum.txt.
You must also increase the energy parameter of the beam card to at least the maximum energy of your spectrum data. I used 200 GeV.
Doing those two changes and running using an executable compiled using source_spectrum.f I managed to run your simulation and scored muon energies compatible with your spectrum file.
Thank you for your answer, I changed the name of the file on line 68 to spectrum.txt and put the energy in the beam card 187.6544 GeV, but after compiling the code, it does not run at all and stay in wating to attach status. Please help more. Thank you
detect.inp (2.0 KB)
source.f (9.3 KB)
source_spectrum.f (10.5 KB)
spectrum.txt (4.3 KB)
Dear Hassan,
I managed to run your input file with the following actions. First, compile the source routine:
ldpmqmd -m fluka -o sim_exec source_spectrum.f
Then run rfluka with the executable and the input file:
rfluka -e sim_exec detect.inp
I reduced the number of events to 1000 for a faster runtime. It runs in less than one minute per cycle for me. Alternatively, it might be more convenient to use the flair interface to compile and start runs. You obtain a collection of *_fort.17 files. To compress them and make plots, I suggest you use flair:
flair detect.inp
In the Run/Data/ tab, you should see the simulation output. If not click Refresh and Scan. Then click compress. Finally, in the Plot tab “Add” a USR-1D plot, select the “File” detect_17_tab.lis, then click Plot.