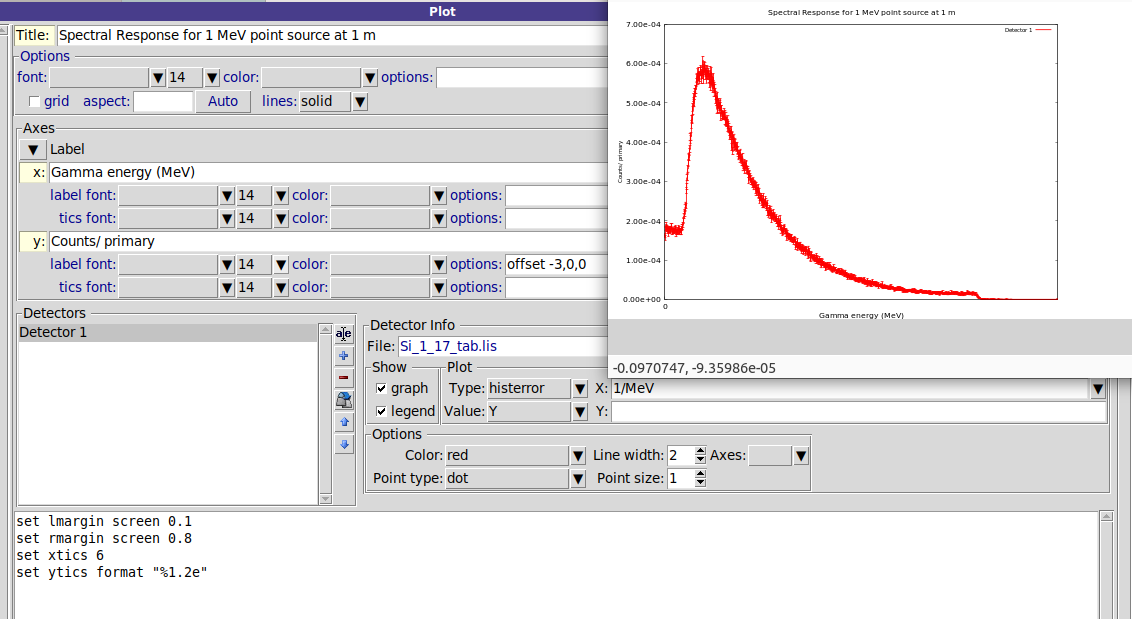
Thank you @amario for the guidance. One more issue I found. I tried to add 6 tics point on X axis. If I write the command in the lower dialogue box, then it is not getting activated in the plot. But it is working on the side text box (Please see the attached image). Earlier I think, it used to work if I write them in the lower box. For example, the command for ytics format is working although it is written in the lower box. Is it normal ??
in the first case you don’t see the set xtics, probably because you limit the x axis to 1 (can’t tell from the picture), and the first tick would be at 6.
The second case seems to be working, but the option is ignored, because the option set xtics 6 is not correct. The set xtics part is automatically added by Flair. You can see this in the output window of Flair, and you should get an error message as well.