Dear FLUKA experts,
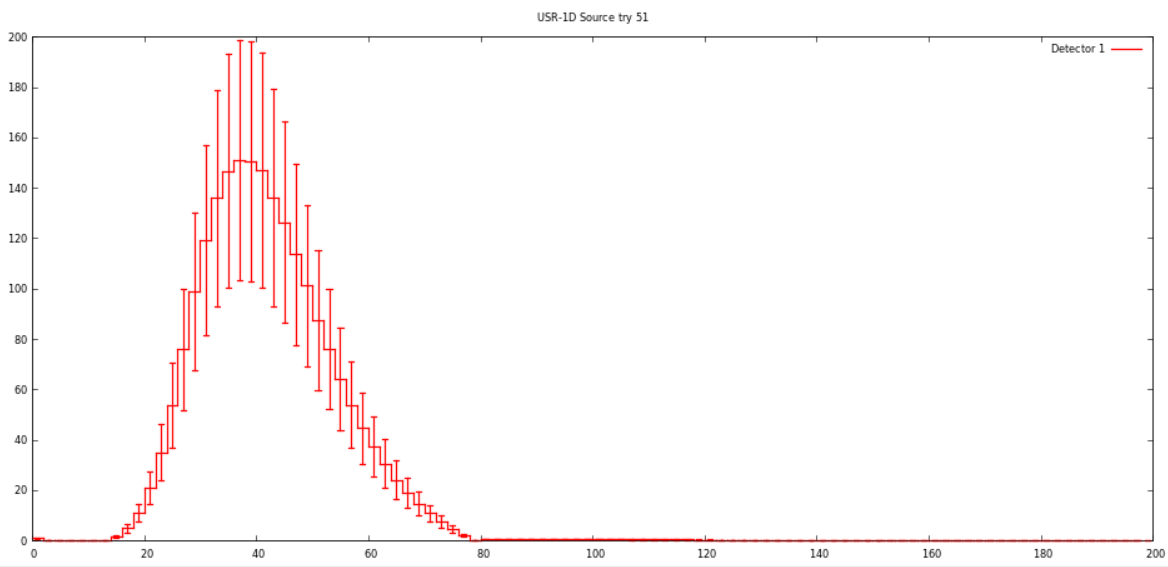
I am trying to build an electron beam using the user routine. While trying to verify if the energy distribution curve is similar to what I would like to obtain, I have noticed that the plot reproduced by USRBDX has some issues with the x axis (Energy values).
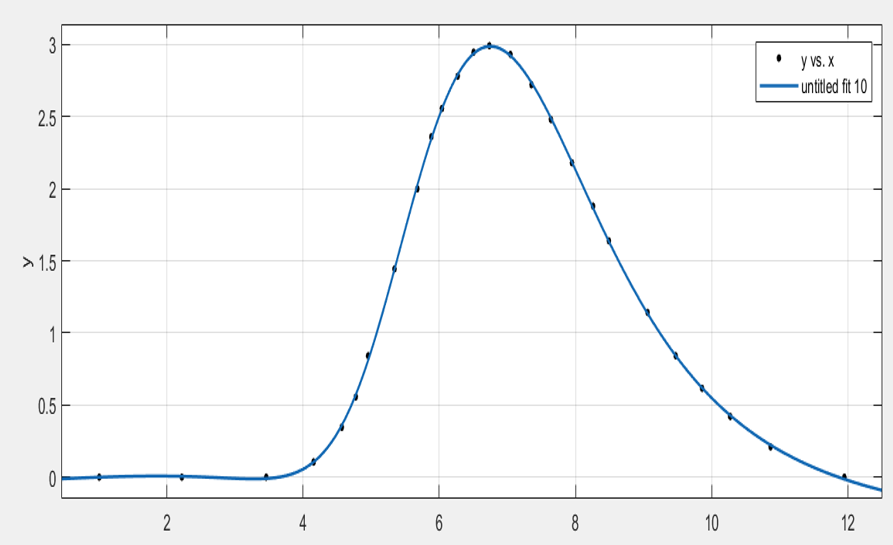
In particular, as specified in the user routine I would like to have the energy values between 2 MeV and 12 MeV as shown in the figure
where the values of energies are completely different.
I am not able to understand the reason of this difference. Source_try.flair (3.7 KB) WPTE_W.f (11.3 KB)
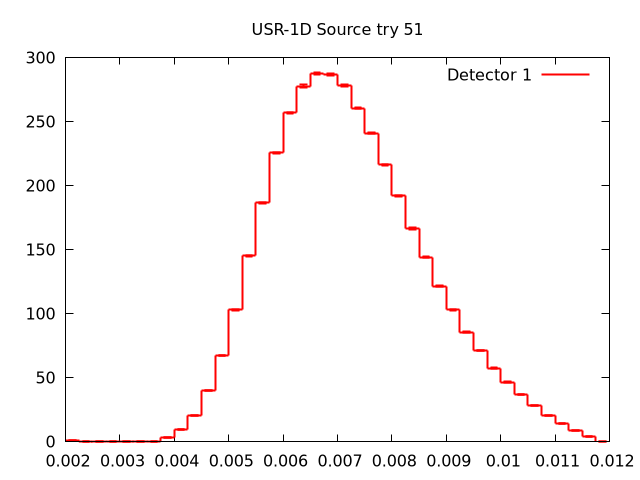
Could you also verify that the Source_try_51_tab.lis file contains the correct energy values?
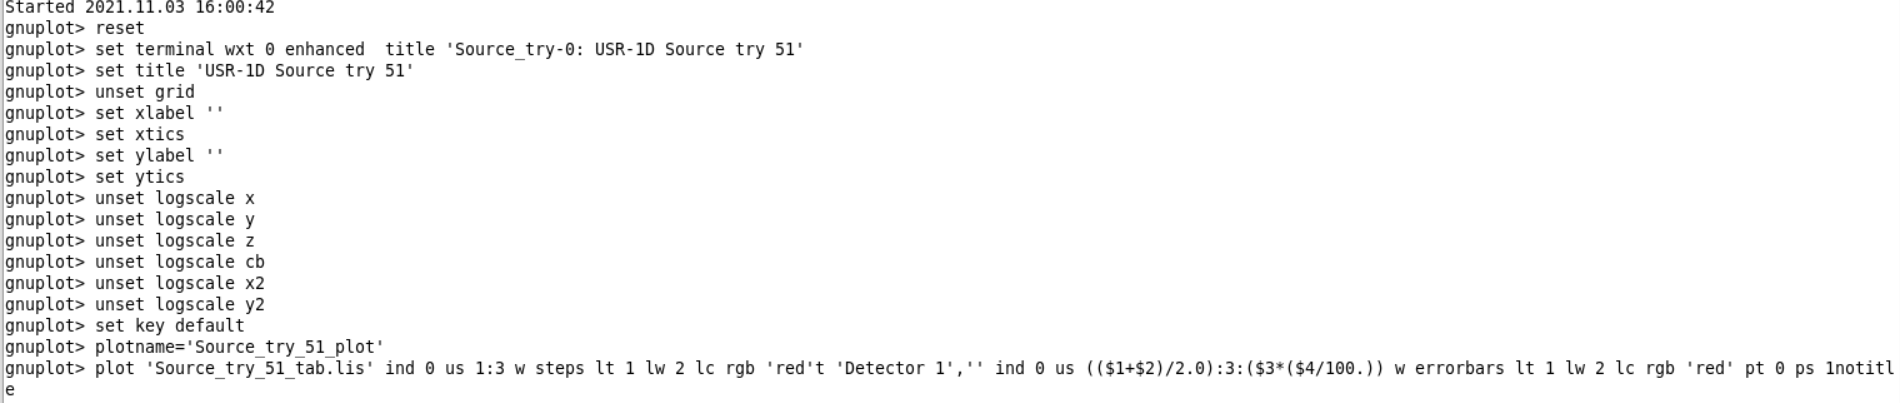
If yes, what happens if you try to plot it with gnuplot directly?