Versions
FLUKA: FLUKA 4-5.0
Flair: FLAIR 3.4-2
Description
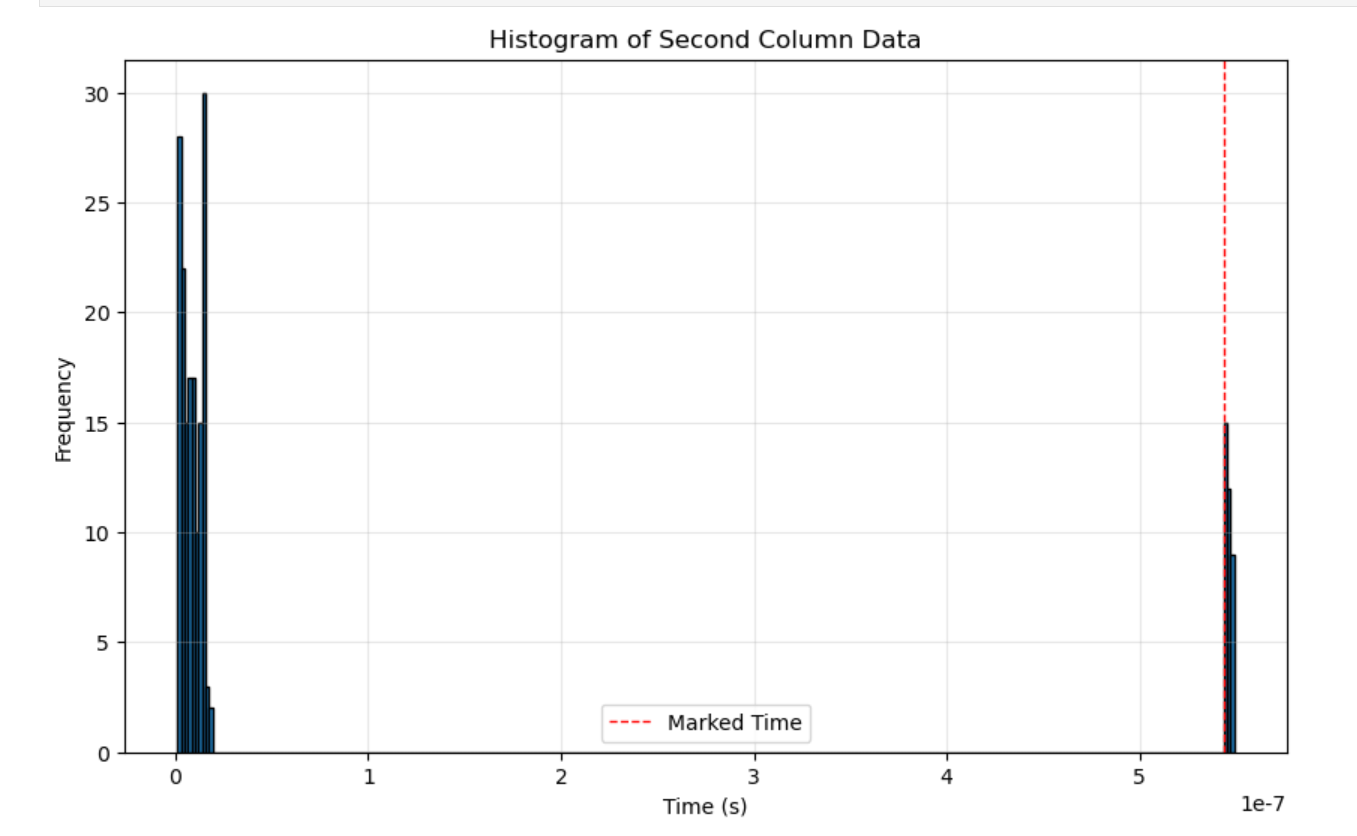
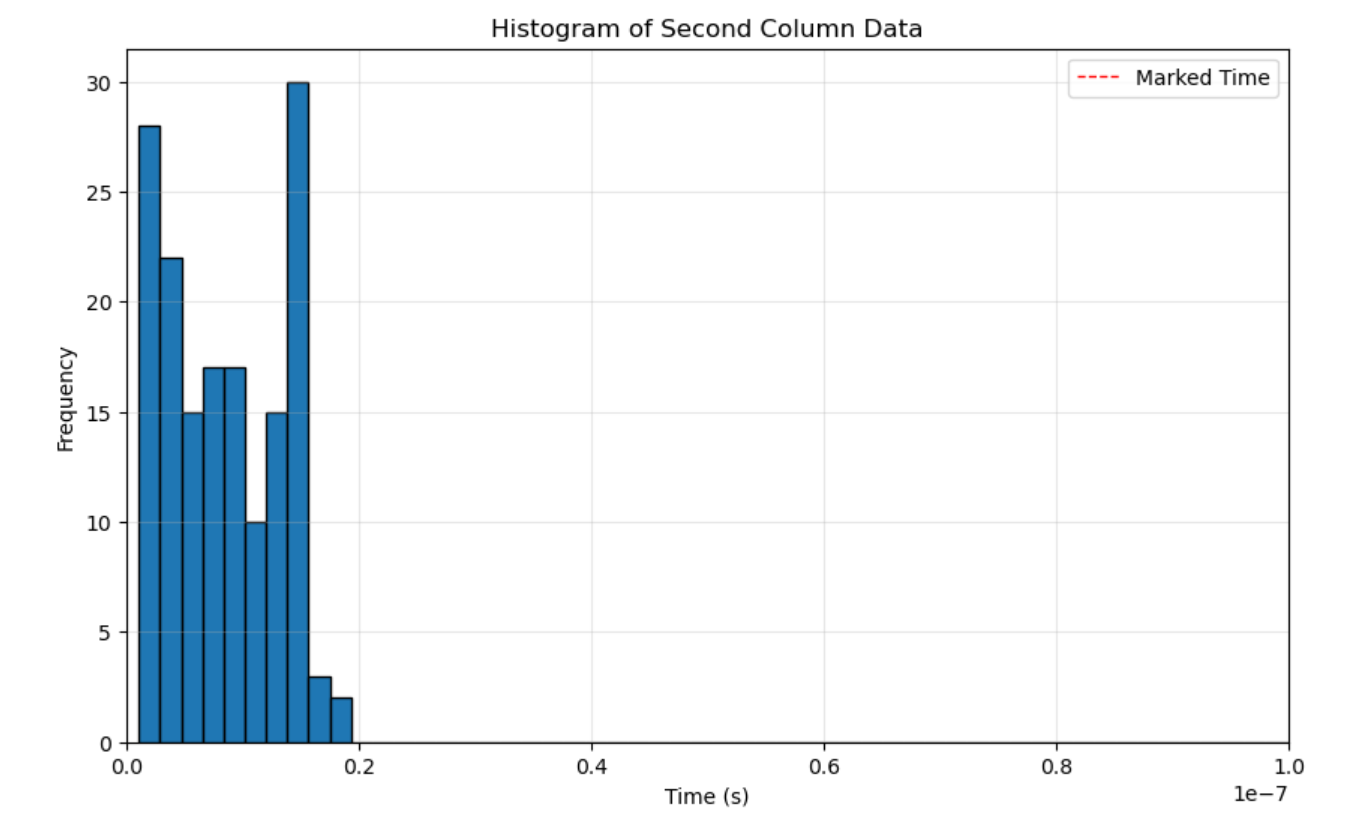
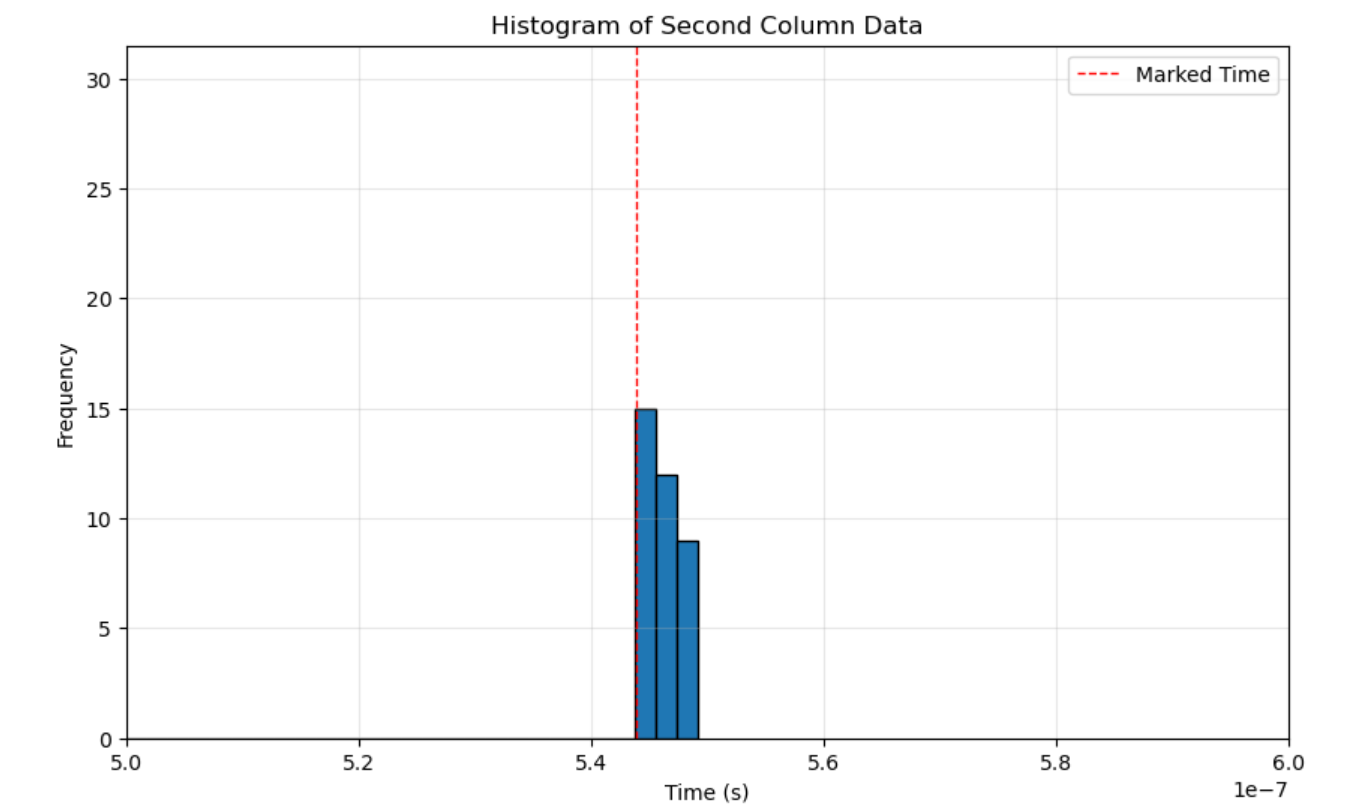
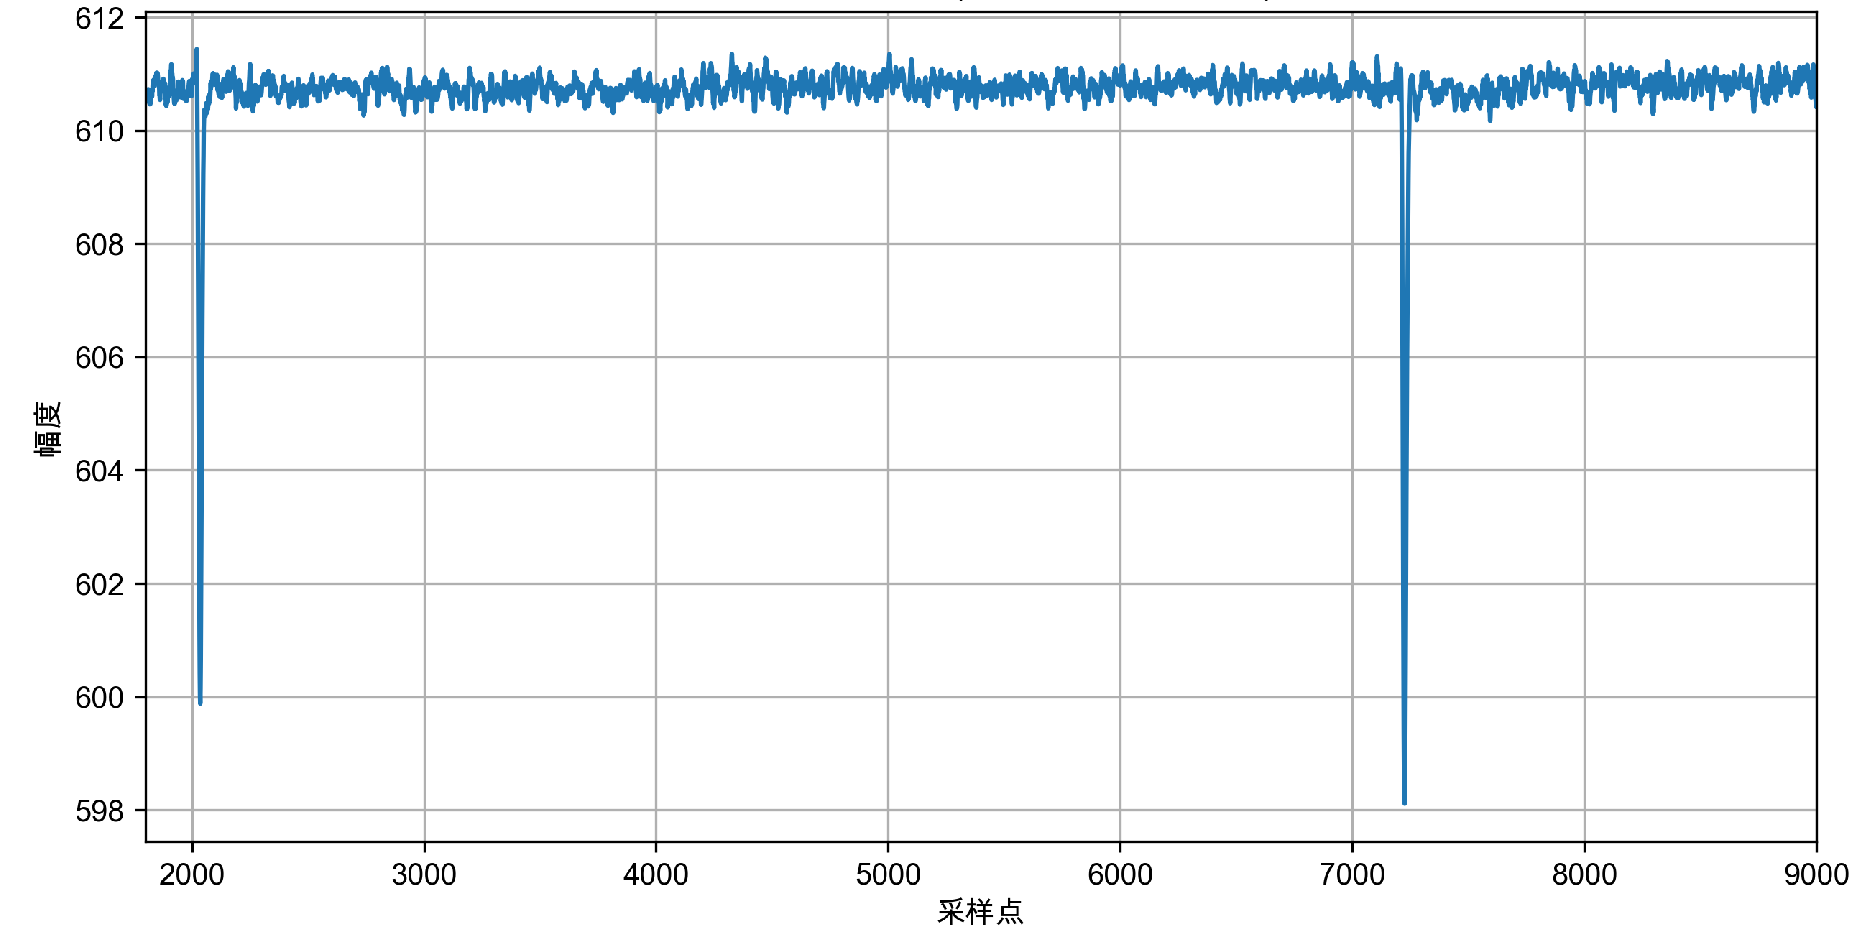
I used the usdraw entry in
mgdraw.fto record the propagation of muons in the scintillator and logged the data at each step. Based on the obtained data, I plotted the distribution of the number of produced photons over time, as shown in the first figure. The red dashed line represents the actual decay time (neutrino production). However, upon zooming in on the two peaks (second and third figures), it was observed that these peaks are highly irregular and differ significantly from the real experimental data (last figure) (EJ200 + PMT + DT5751).
Can you tell me what might be causing this?
ENTRY USDRAW ( ICODE, MREG, XSCO, YSCO, ZSCO )CALL GEOR2N (MREG, NAMREG, IERR1)
OPEN (10, FILE=“3He_detector_mgdraw.dat”)IF (NAMREG.EQ.“Box”) THEN
IF (NP.EQ.3 .AND. (KPART(1).EQ.28 .OR. KPART(2).EQ.28
& .OR. KPART(3).EQ.28 .OR. KPART(1).EQ.27 .OR. KPART(2).EQ.27
& .OR. KPART(3).EQ.27)) THEN
WRITE(10,*) NCASE,ATRACK,JTRACK,XSCO,YSCO,ZSCO,
& NAMREG,NP,KPART(1:NP),TKI(1:NP)ELSE IF (NP.EQ.2 .AND. (KPART(1).EQ.7 .OR. KPART(2).EQ.7))& THEN
WRITE(10,*) NCASE,ATRACK,JTRACK,XSCO,YSCO,ZSCO,
& NAMREG,NP,KPART(1:NP),TKI(1:NP)ELSE IF (NP.EQ.3 .AND. (KPART(1).EQ.7 .OR. KPART(2).EQ.7& .OR. KPART(3).EQ.7)) THEN
WRITE(10,*) NCASE,ATRACK,JTRACK,XSCO,YSCO,ZSCO,
& NAMREG,NP,KPART(1:NP),TKI(1:NP)END IFEND IF
IF ( .NOT. LFCOPE ) THEN
LFCOPE = .TRUE.
IF ( KOMPUT .EQ. 2 ) THEN
FILNAM = ‘/’//CFDRAW(1:8)//’ DUMP A’
ELSE
FILNAM = CFDRAW
END IF
OPEN ( UNIT = IODRAW, FILE = FILNAM, STATUS = ‘NEW’,
& FORM = ‘UNFORMATTED’ )
END IFRETURN
END
I have uploaded the .inp and hope you can help me resolve the issues. I would be grateful.Best
Yongce,
Input files
FLUKA_geometry.inp (2.4 KB)