Dear @sy2119104 , many thanks for your further explanations. Addressing your statements here:
I believe it is still expected that the location with the highest amount of a particular nuclide should also have the highest activity, as more nuclide production would lead to more decays.
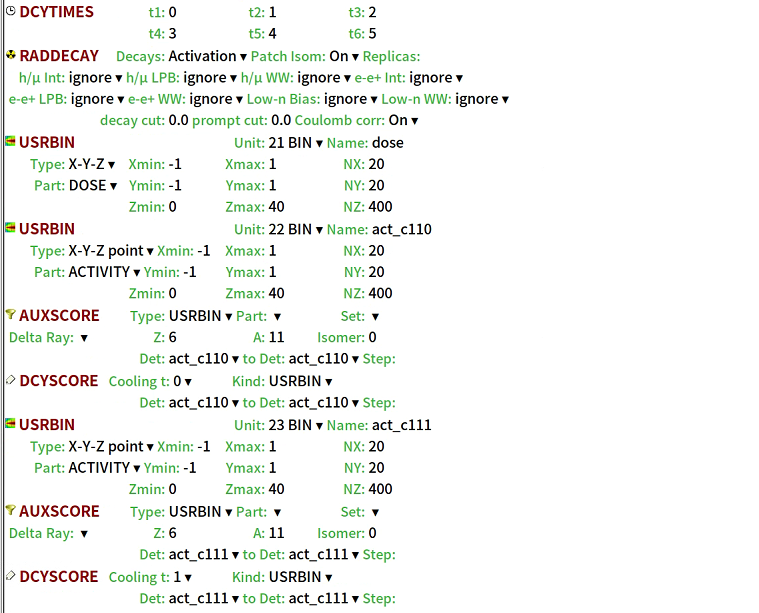
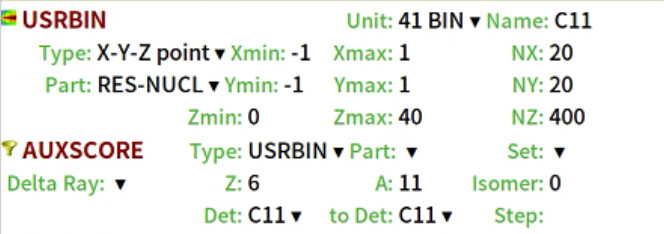
This is fully correct. To clarify how it works in FLUKA: the activity is calculated based on the residual nuclei produced (which you can obtain through RES-NUCLEi scoring) but just applying the decay law for that particular isotope (which takes also into account its possible production through the decay of other isotopes).
Or, could it be that the RES-NUCLEi scoring reports the nuclide yield at “static” positions, whereas decay does not occur at these static locations? Some nuclides may decay along their path to these static locations, which might explain why the activity peak appears before the yield peak in my results, especially within the first 5 seconds.
This is incorrect since, as mentioned above, the activity is calculated directly from the residual nuclei which are scored at their final position, i.e. when they came to rest.
It can be observed that the peak of the yield is located near the Bragg peak of the dose, with a slight spatial shift.
This also makes sense, since the prompt dose is mostly due to the primary 12C ions. The different radioisotopes you look at are produced all along the primary 12C ions path and a perfect agreement between the dose (due to 12C) and the yield (resulting from all residual nuclei coming to rest) does not happen.
Notably, for the same energy, the maximum value of the activity (bottom blue line) is located slightly earlier than the maximum value of the nuclide yield (top blue line).
Not really, since here you are comparing activity vs dose, not yield. It is also not so easy to see when comparing the top and bottom rows if there is a clear difference between yield and activity. We would suggest to score the yield and activity curves corresponding to a single isotope (e.g. 11C). When doing this check on our side, the yield and activity curves are identical apart from a normalization factor, so they peak at exactly the same depth.
This may be attributed to decay occurring during the transport of nuclides, as well as differences in decay rates and the half-lives of the isotopes produced.
So no decay during transport happens but the different decay rates are correctly applied as in fact you can see very well from your plots: e.g., the yield for 10C is the lowest but in fact the resulting activity is the highest.
Hopefully this helps!
Andreas & Francesco