Dear FLUKA experts,
I am trying to score dose deposition in a water sphere when a monoenergetic, point alpha-particle source is placed at its center, for energies between 3 and 8 MeV. I am comparing the FLUKA results with those obtained using the Monte Carlo code PENHAN.
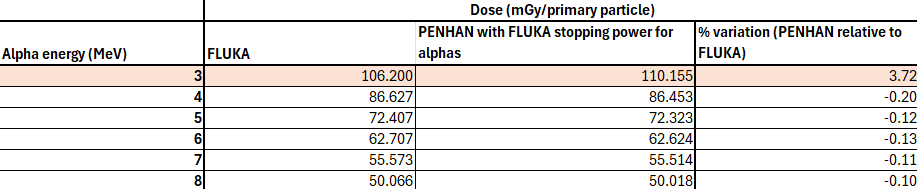
In most cases, I observed percentage variations of around 2-3% between the two codes, calculated as:
variation = ((value_PENHAN - value_FLUKA)/value_FLUKA)*100
I assume that these differences, besides the different simulations approaches and physics models, are related to differences in the alpha stopping powers in water used in each code. However, as shown in the attached table (‘table.png’), I obtained a significantly larger discrepancy (around 6%) for 3 MeV alpha particles, while differences in the stopping power for these lower energies are not that much.

To investigate this issue for 3 Mev alphas, I conducted three FLUKA simulations:
- In Simulation 1 I set the electron transport energy cutoff to 1 keV (via EMFCUT card) and the delta-ray production cutoff to 1 keV (via DELTARAY card). This gave me the already reported results.
- In Simulation 2 I increased the delta-ray production cutoff to 10 keV, so no secondary electrons are produced due to the low energy of the alphas. I would expect to obtain a similar result, since in Simulation 1 the produced electrons have very low energies and therefore should deposit their energy close to their production sites. Nevertheless, in Simulation 2 I obtained a higher dose, ~110 mGy, closer to PENHAN’s result.
- In Simulation 3, I maintained the delta-ray production cutoff in 1 keV and increased the electron transport energy cutoff to 100 keV. With this all generated electrons should deposit their energies in the production site. Here I obtained a similar dose than in Simulation 1.
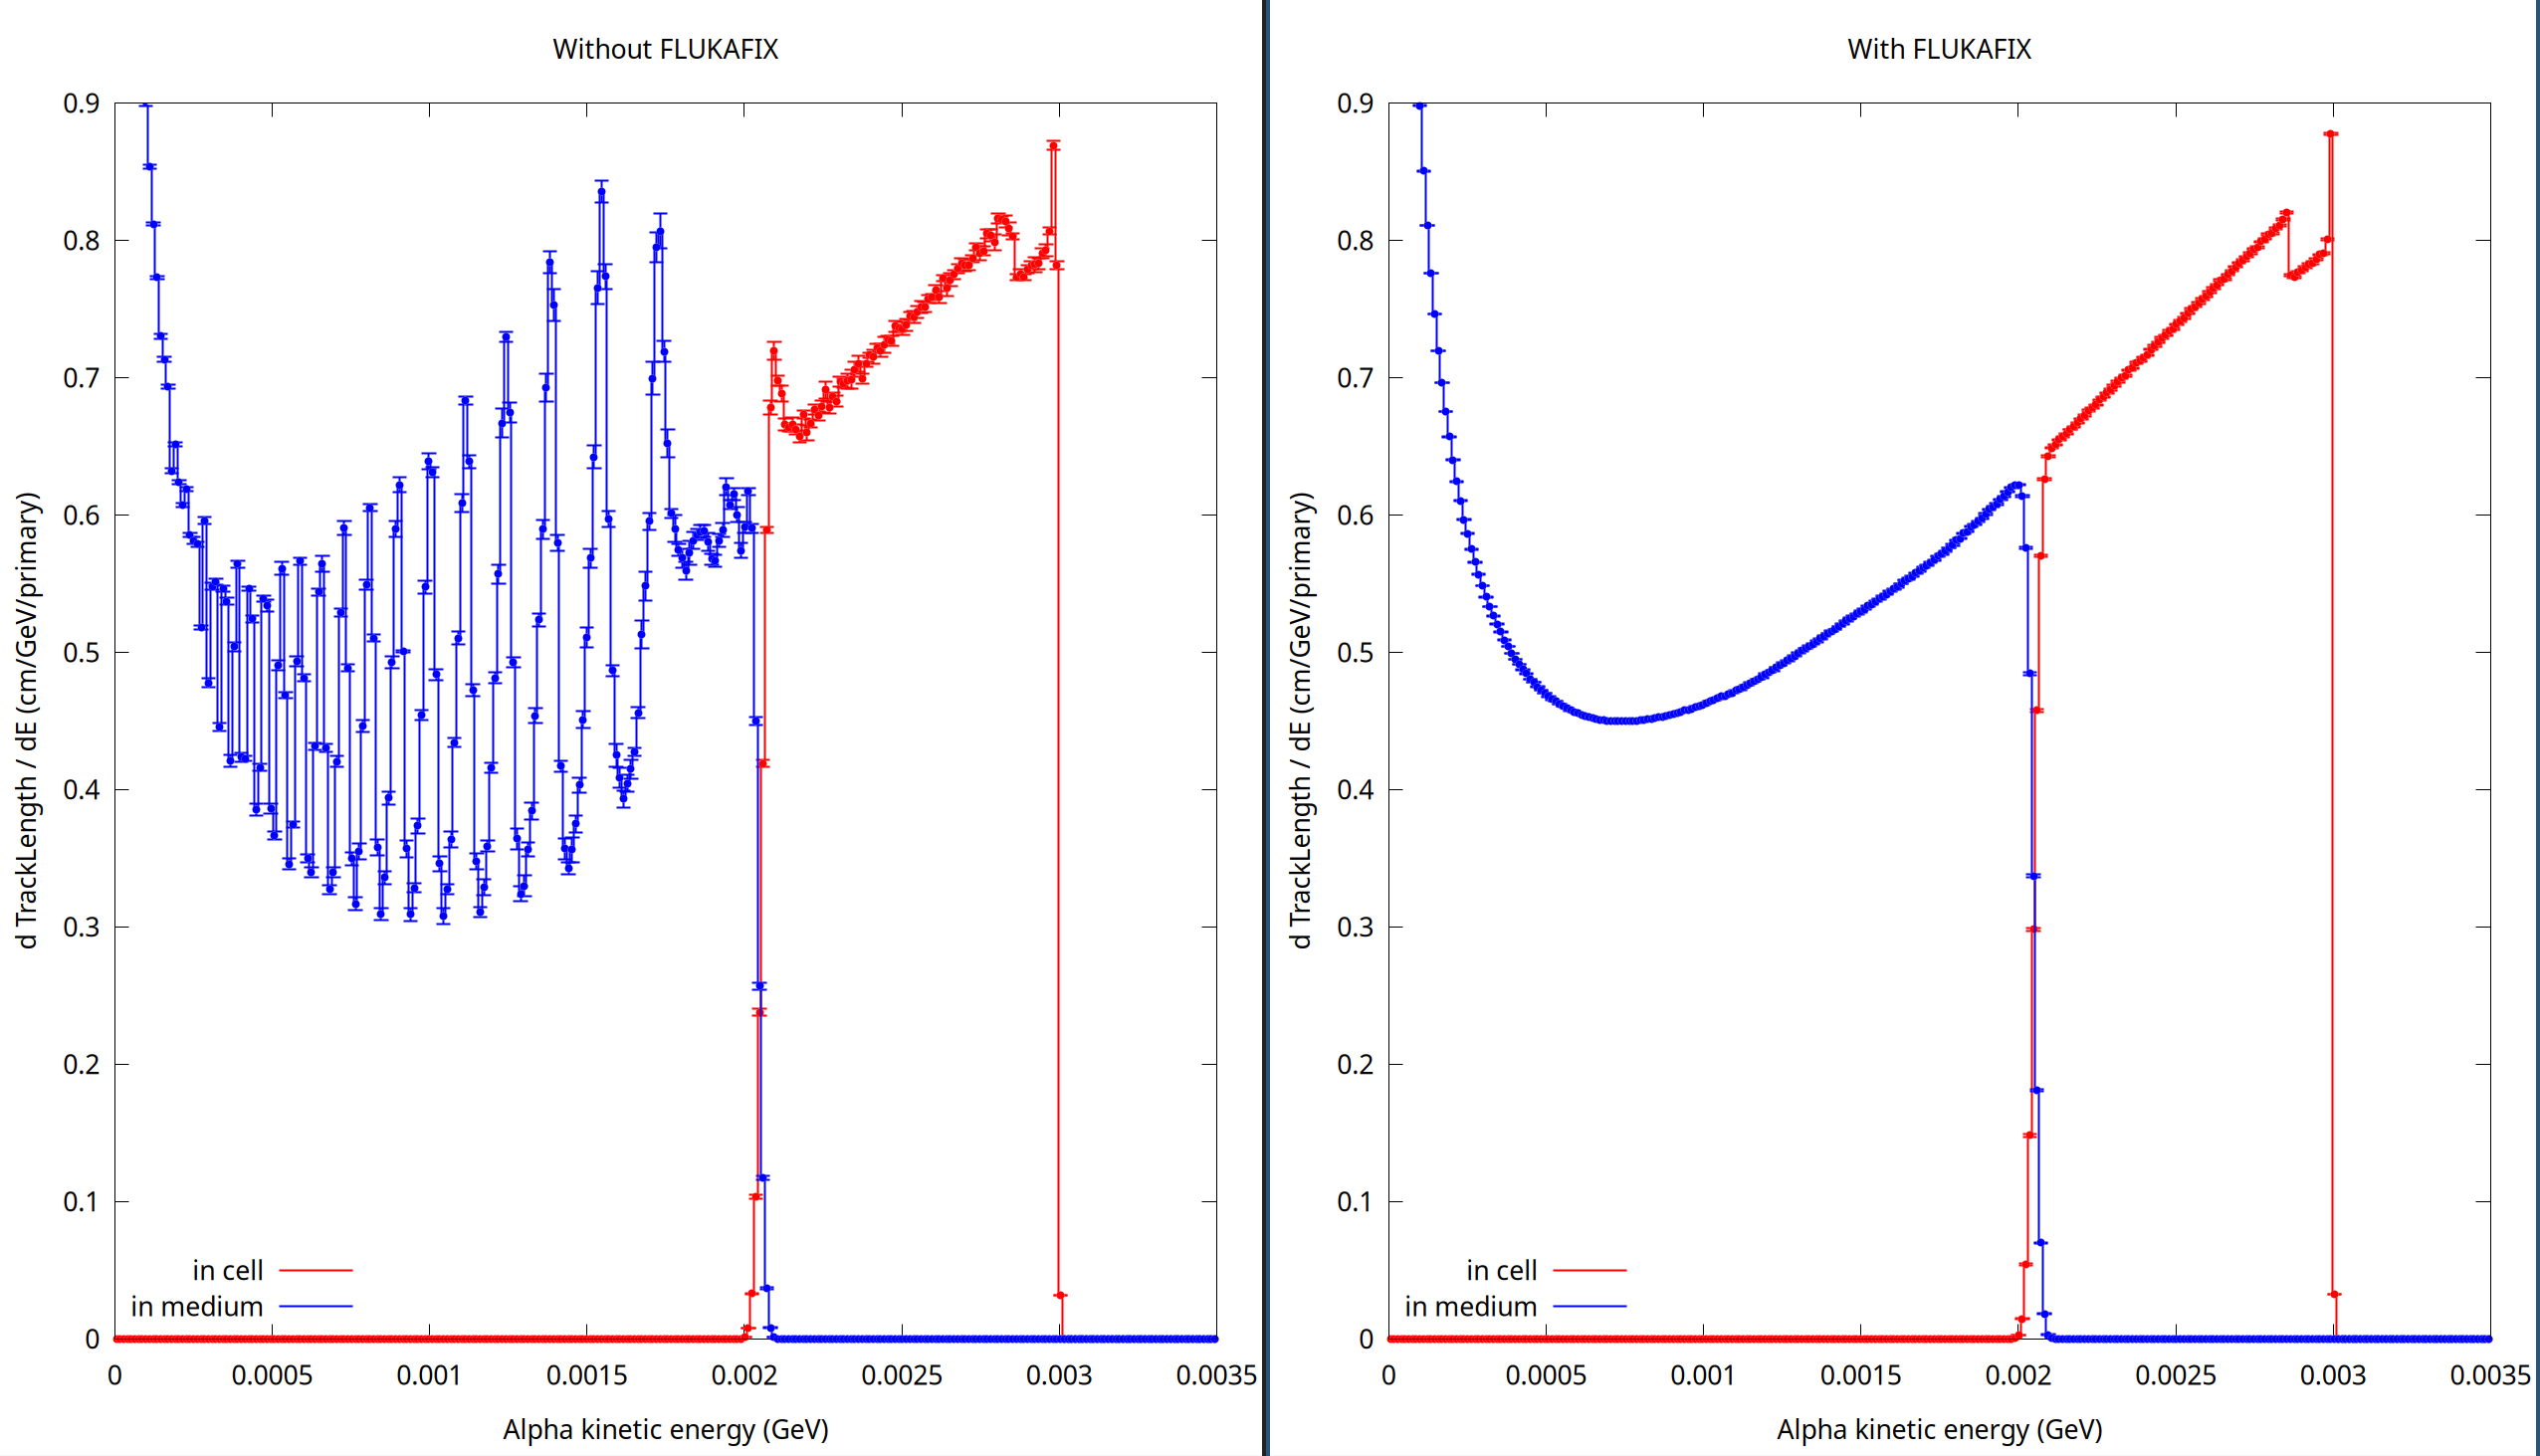
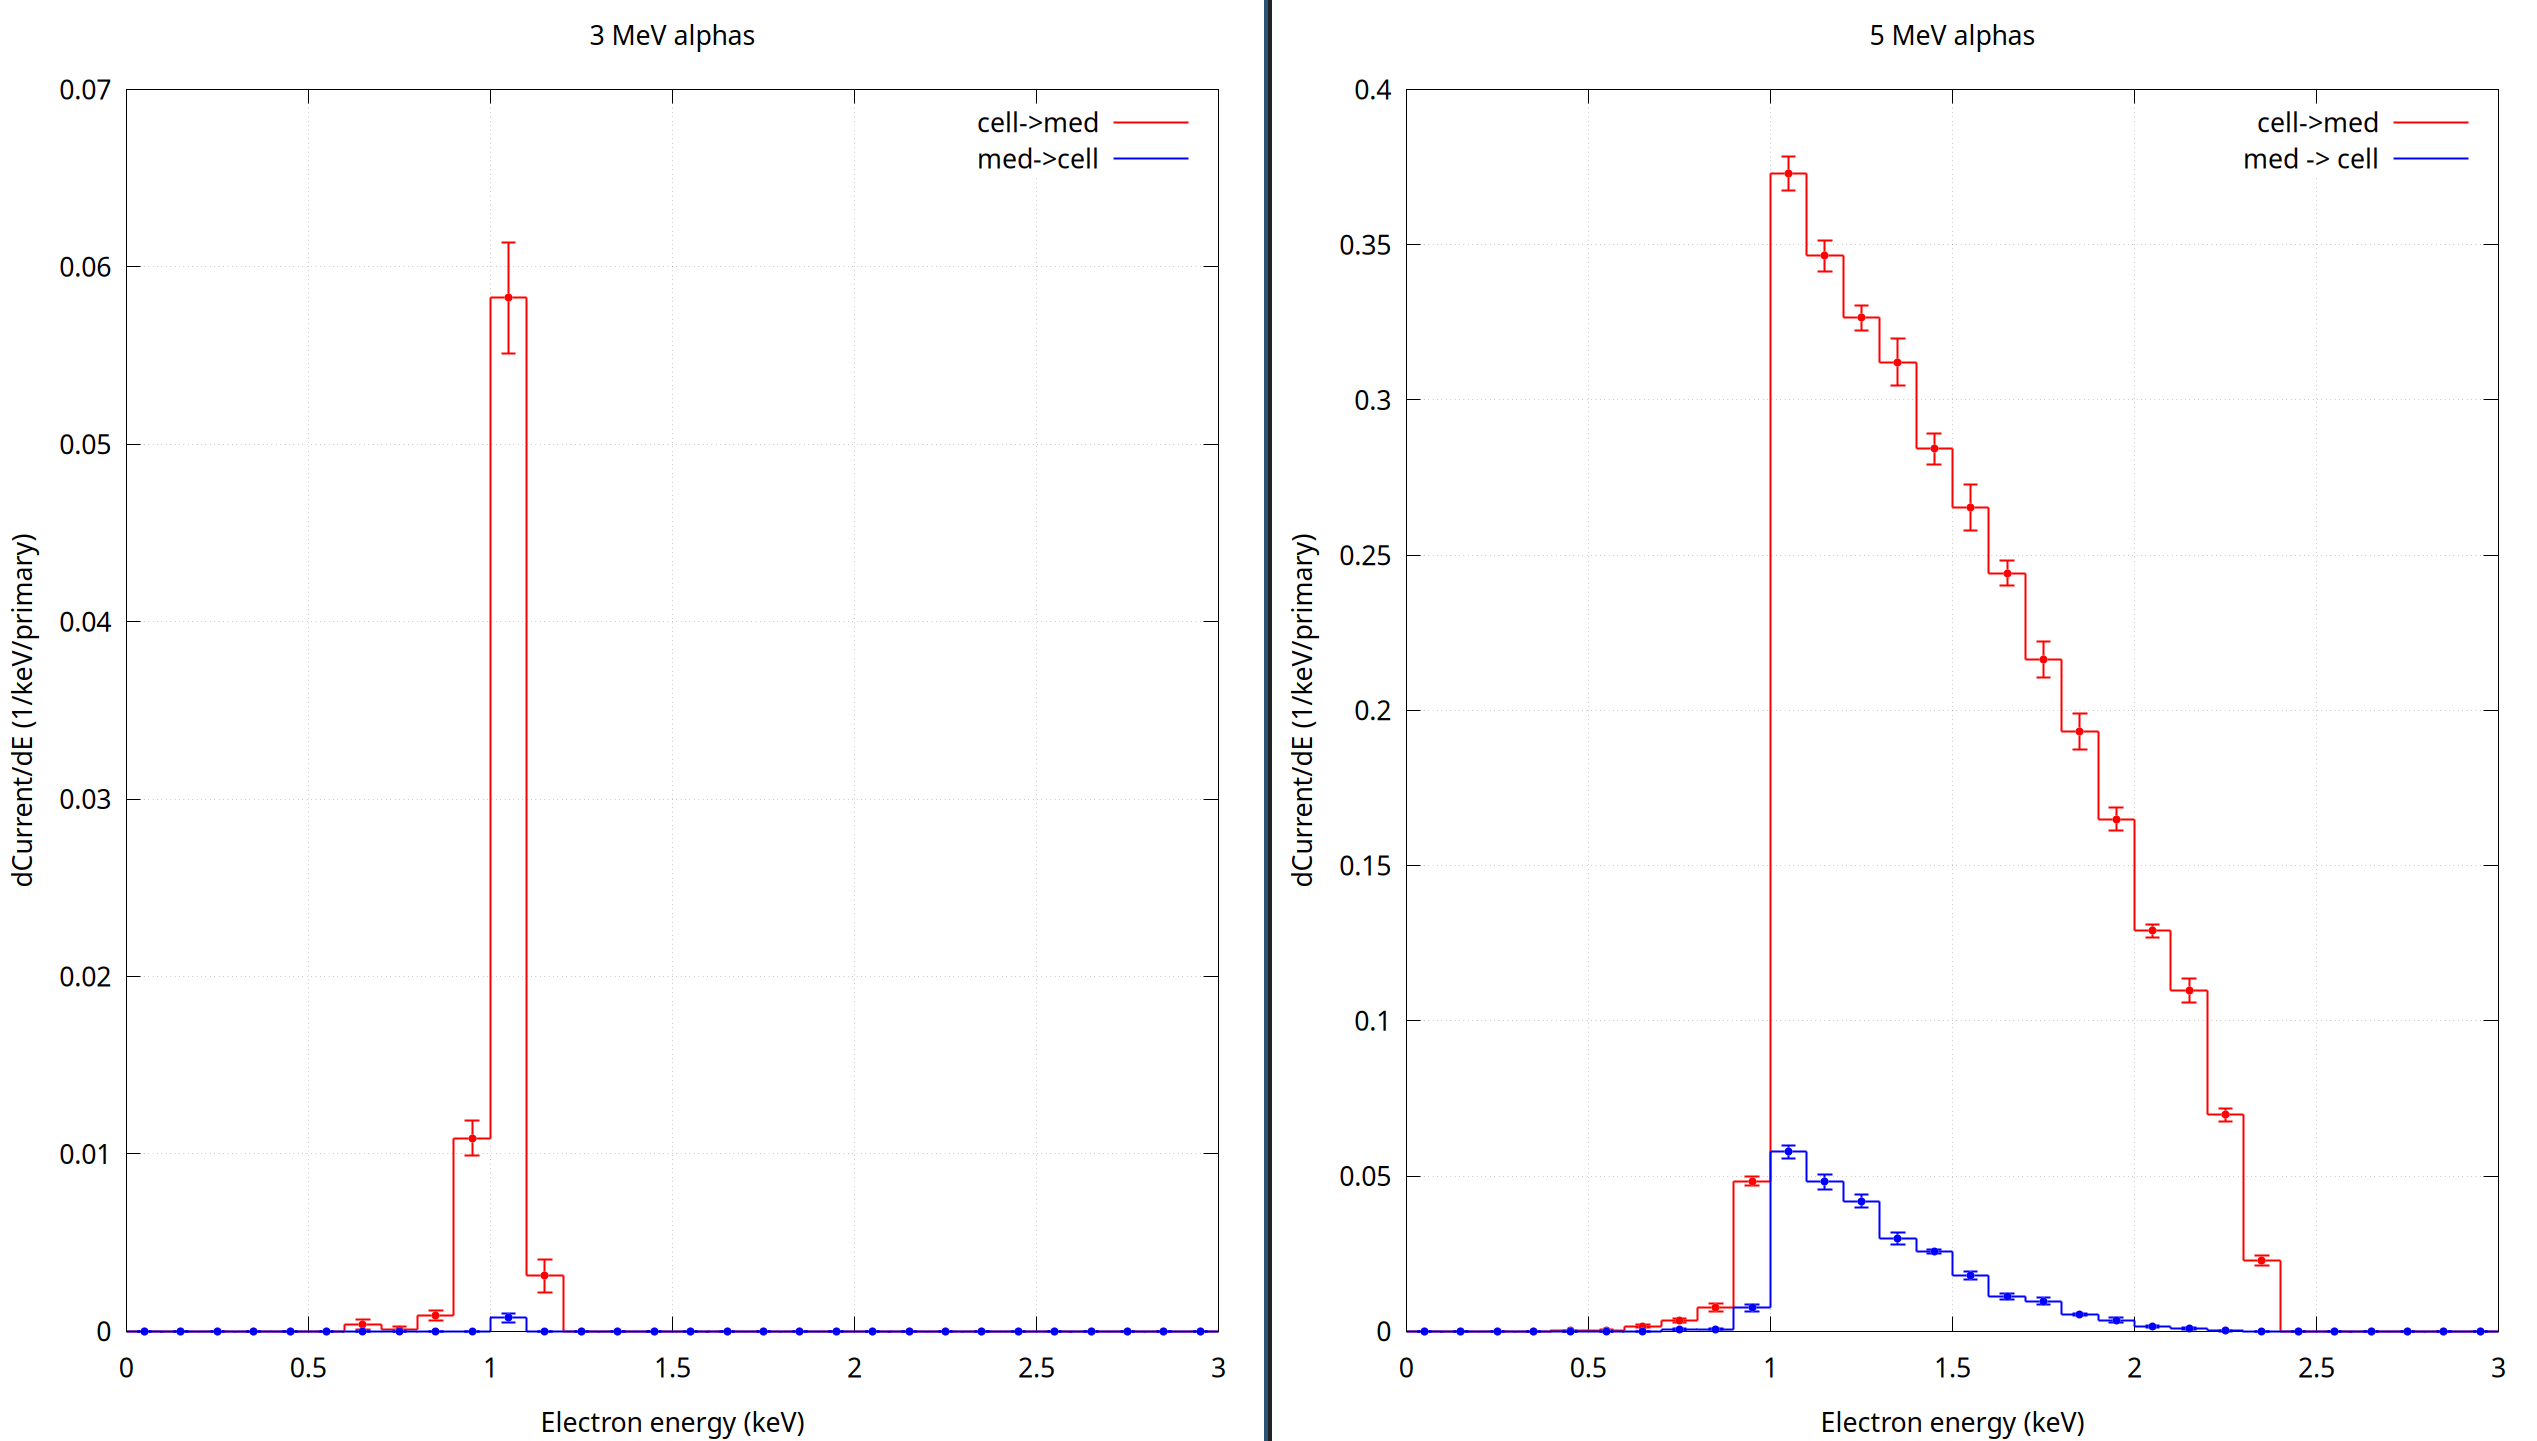
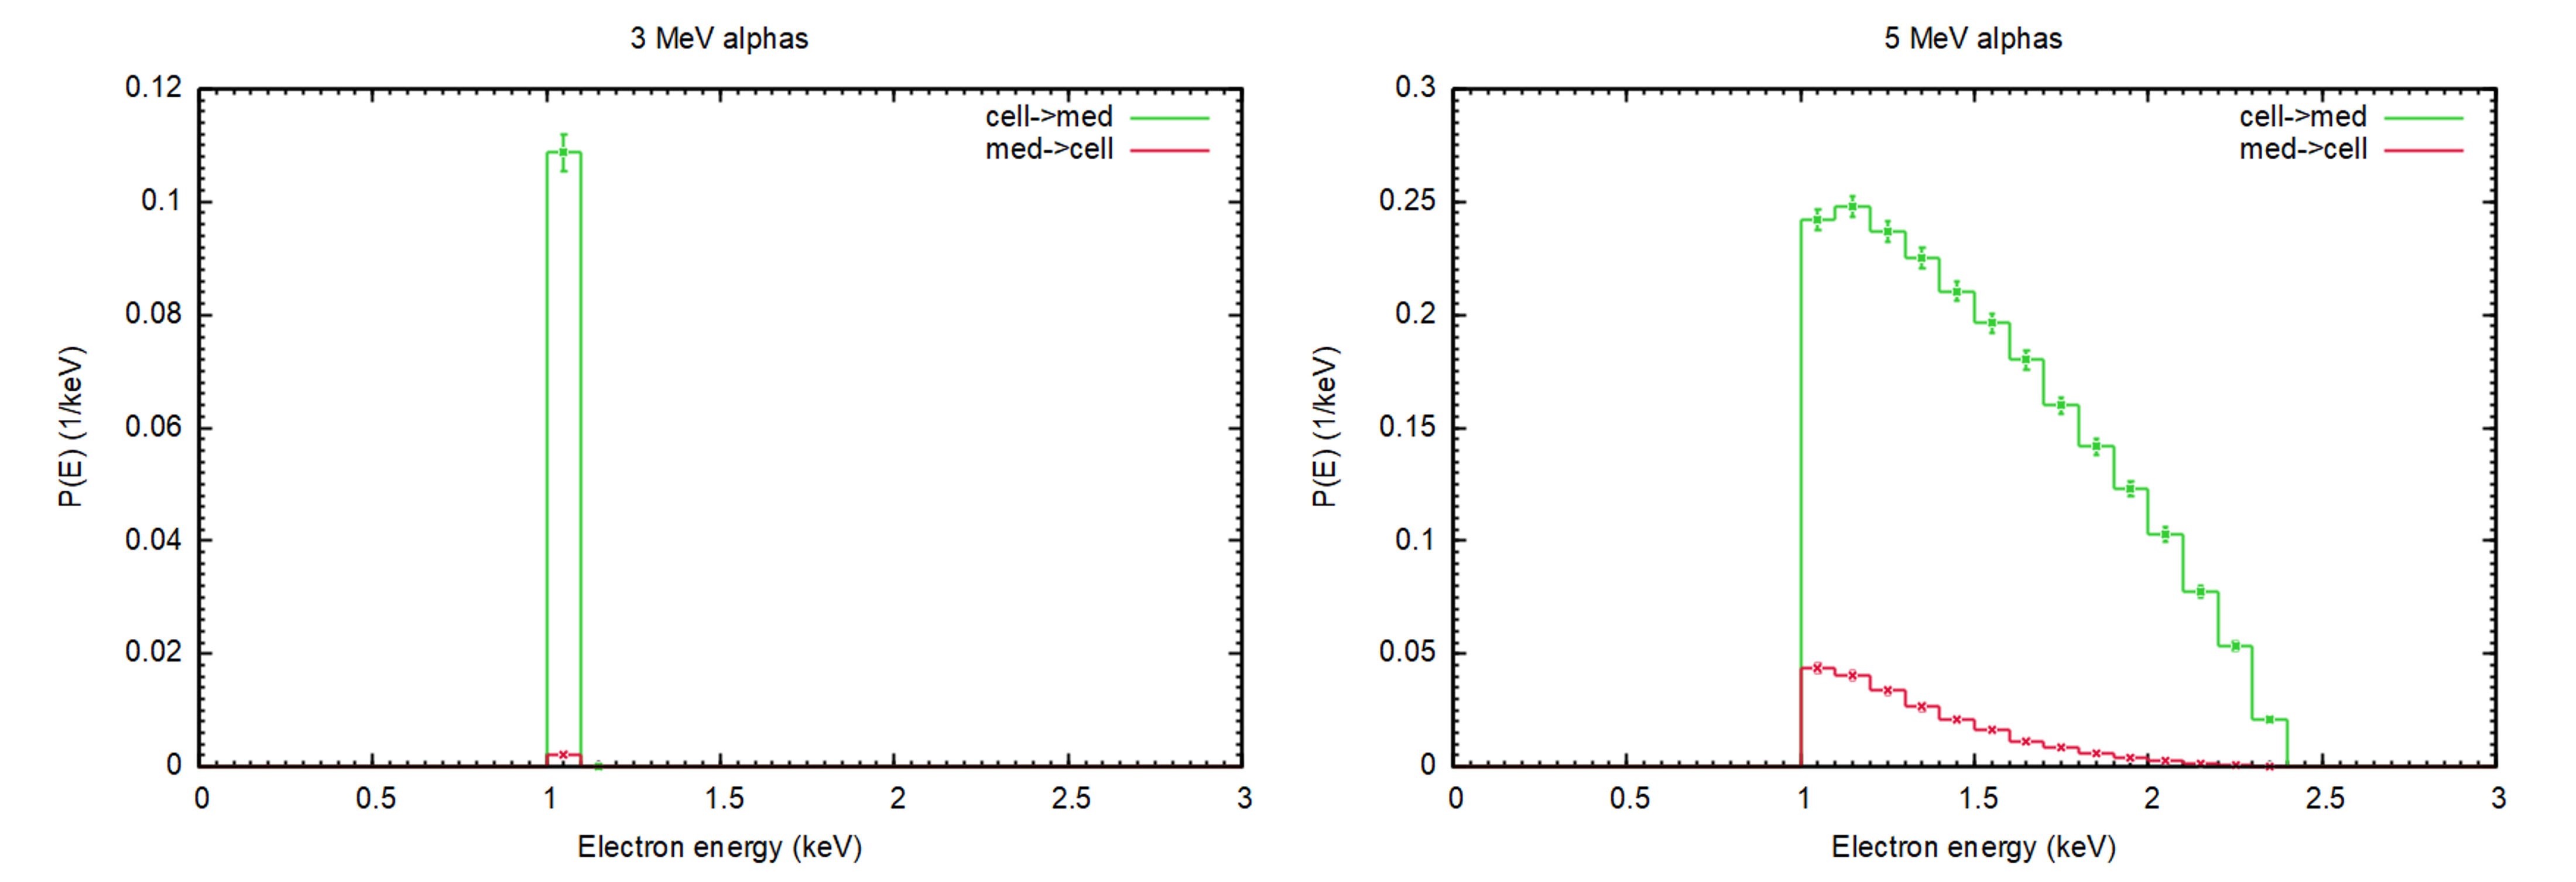
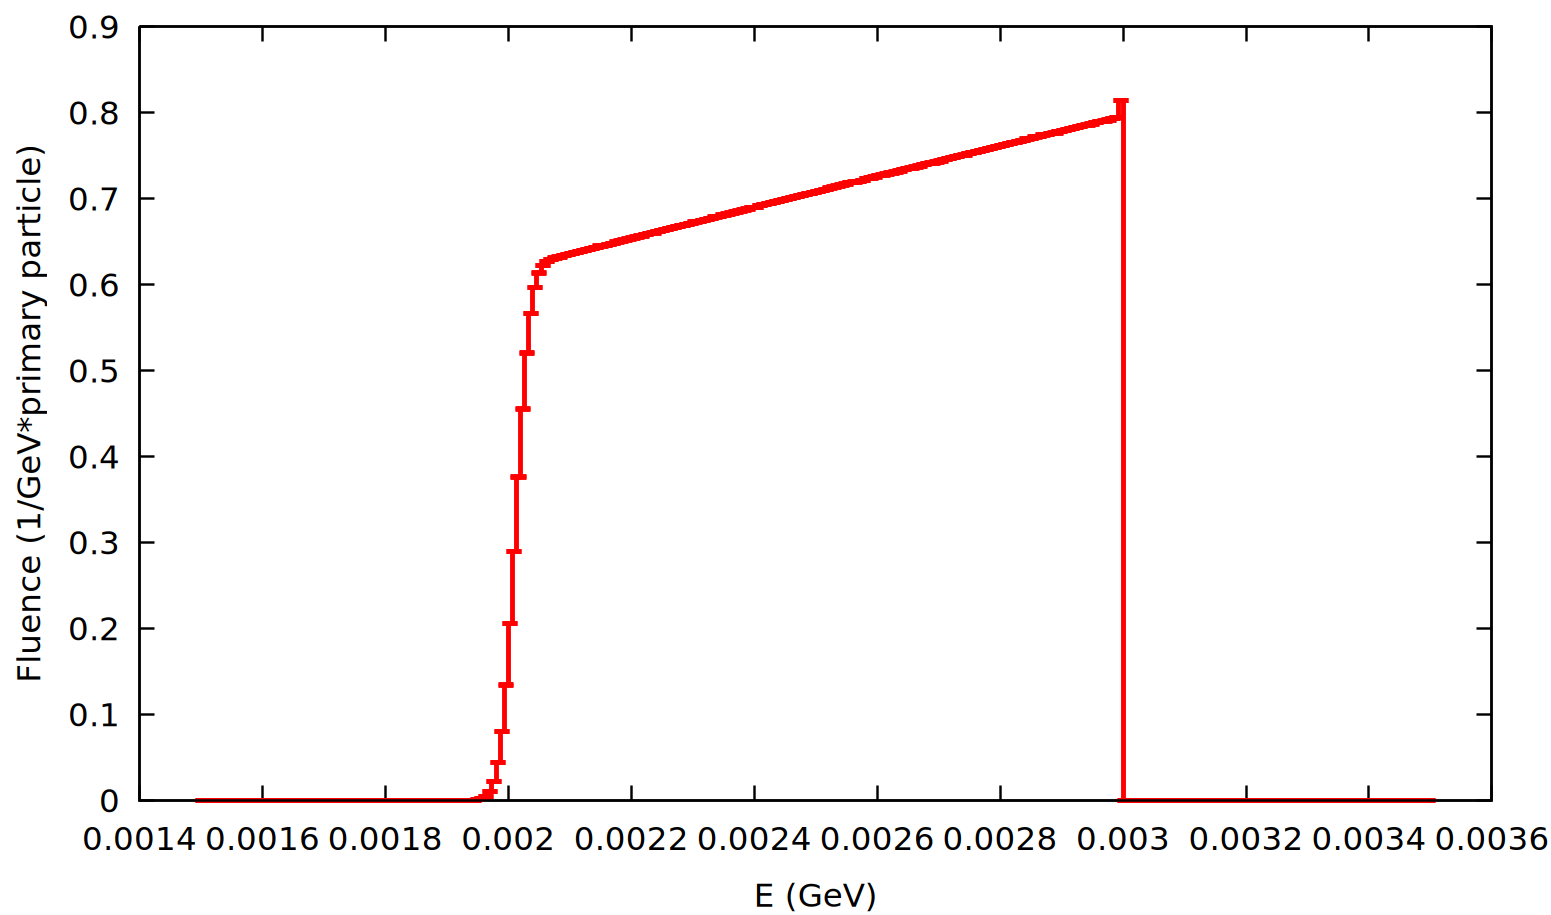
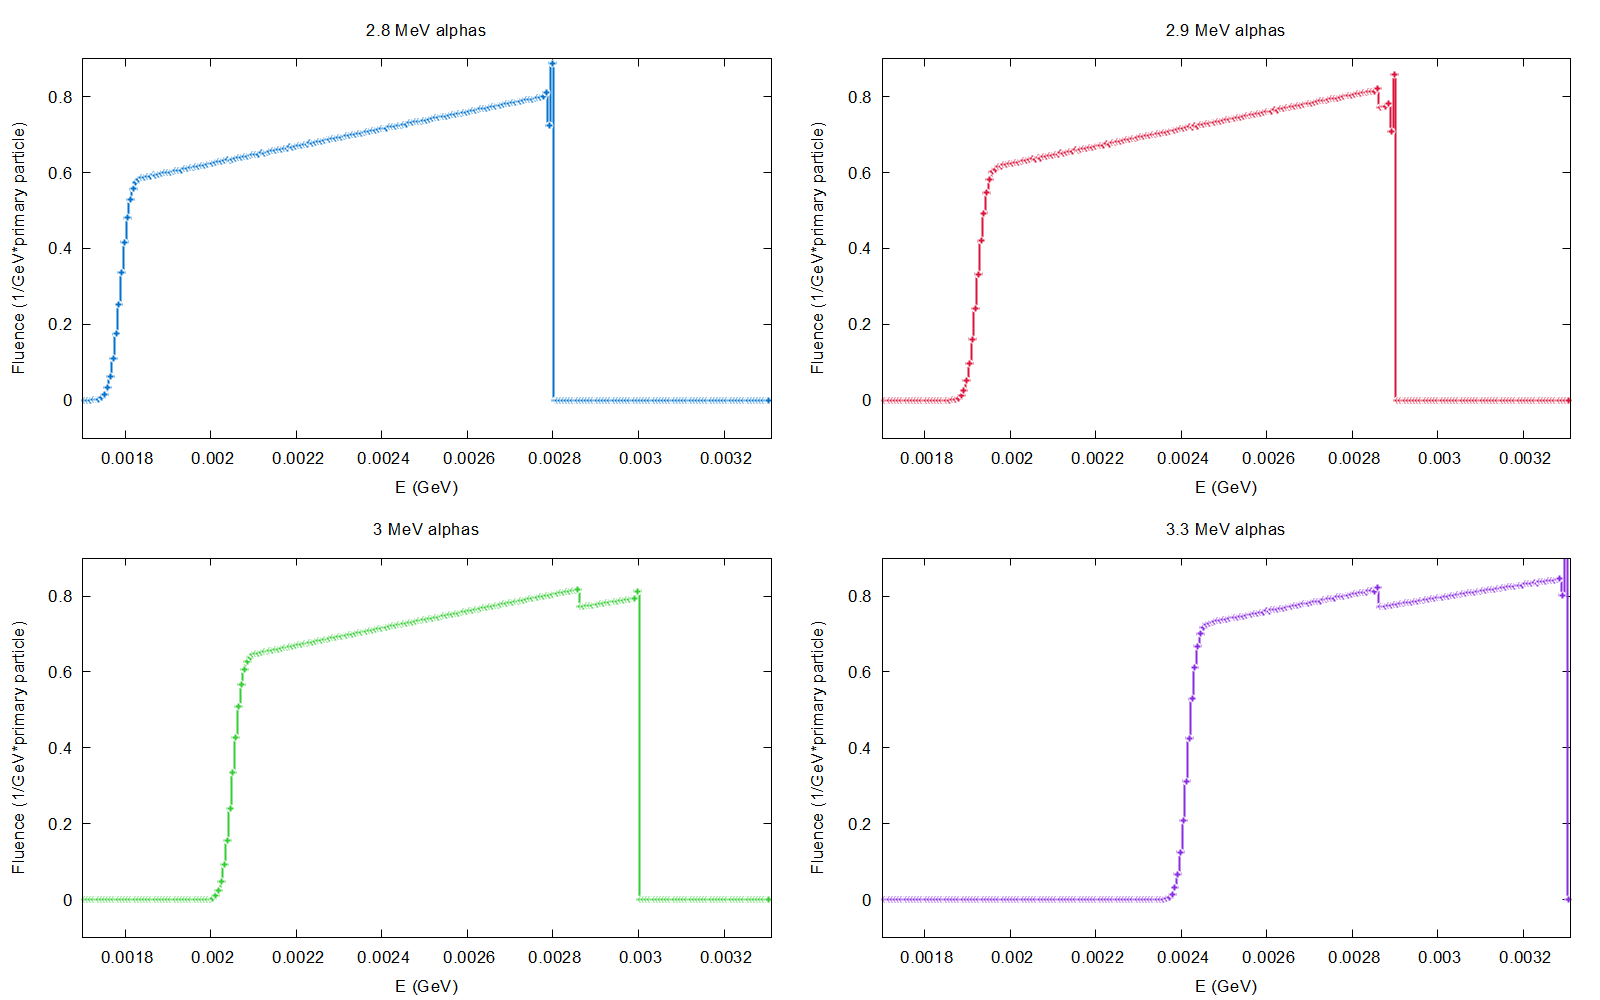
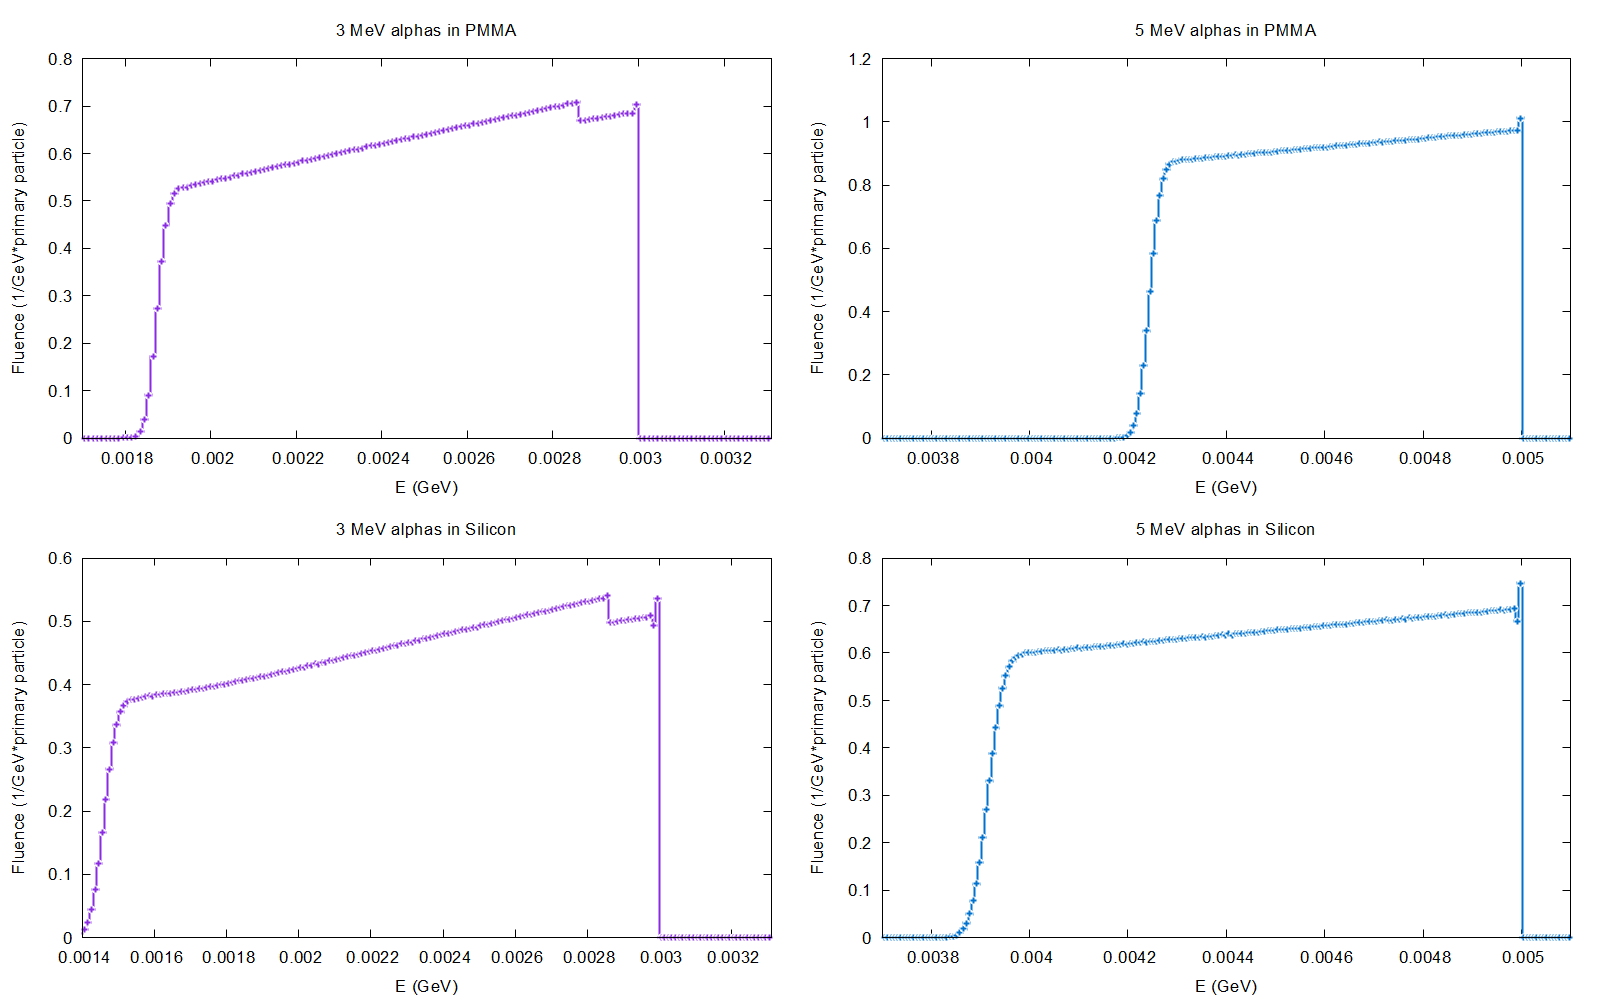
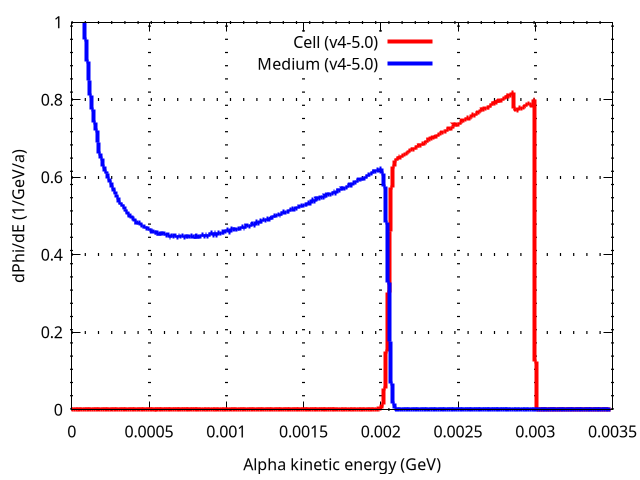
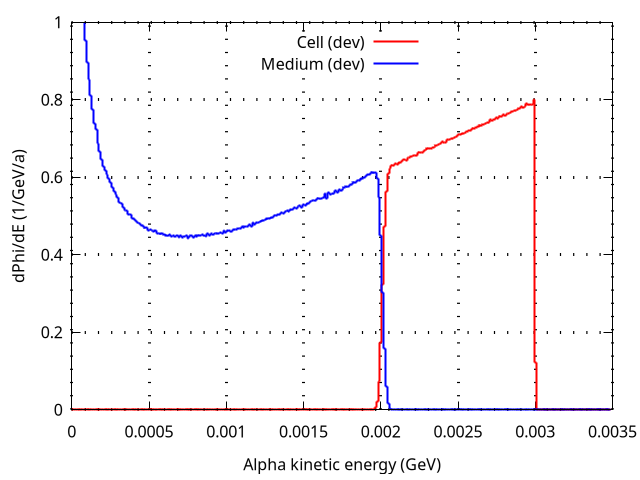
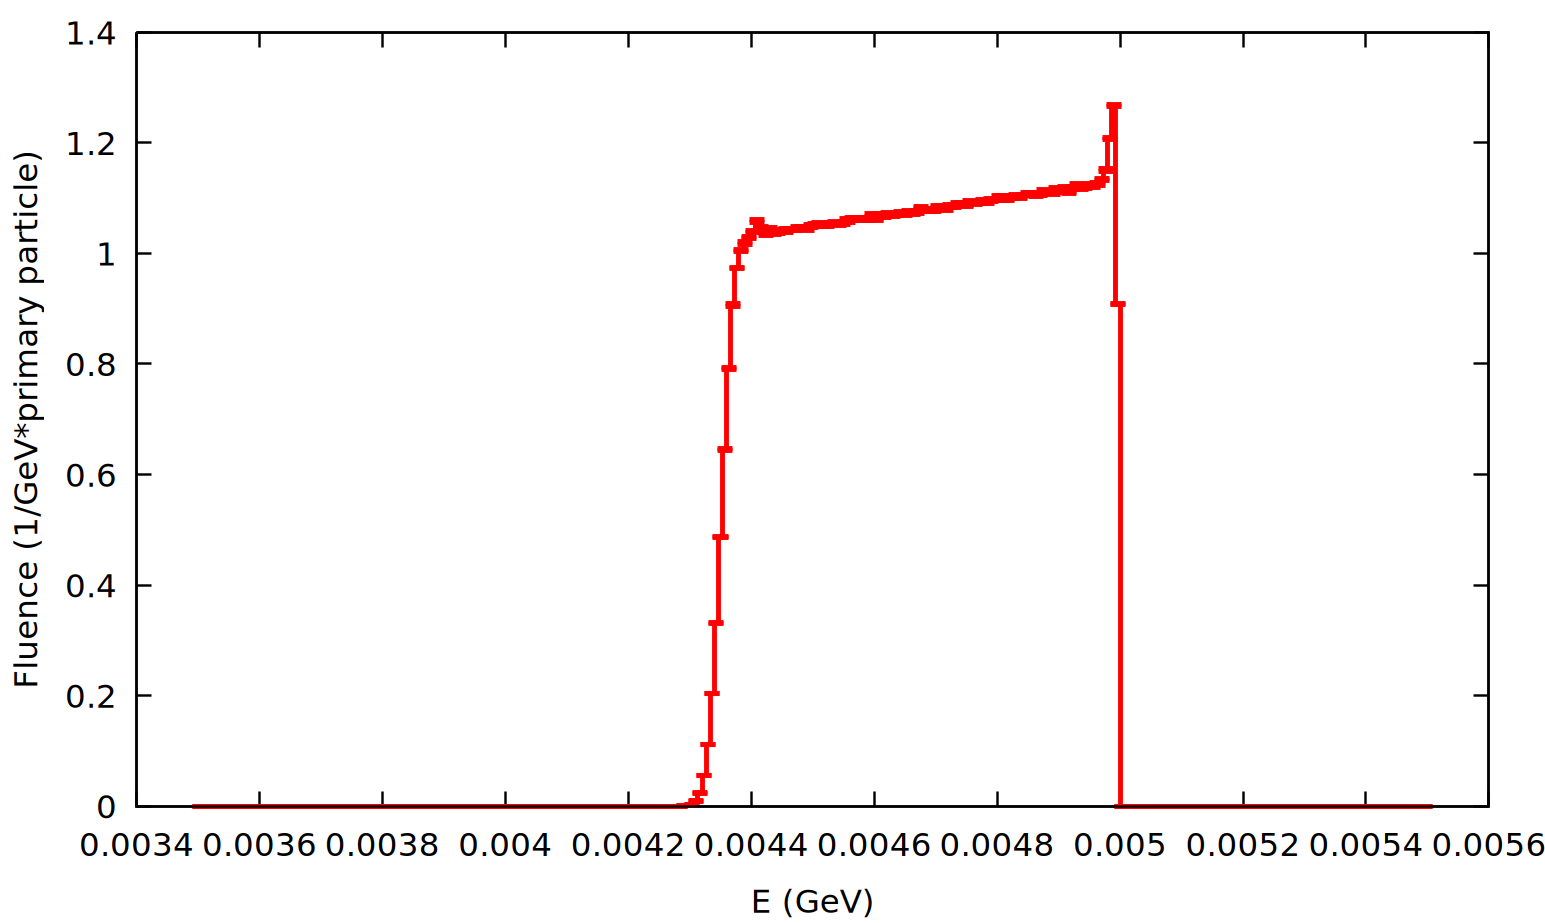
Additionally, I analyzed the alpha and electron fluences within the sphere using a USRTRACK card in Simulation 1. For 3 MeV alphas, the fluence distribution seems to show an unusual behavior compared to higher energy cases. I attach the corresponding graphs for 3 and 5 MeV (fluence_3_mev.png and fluence_5_mev.png).

Could you help me understand these results for 3 MeV alphas? Specifically:
- Why does the fluence distribution show that unexpected behavior?
- Where is the missing energy going, leading to such a low deposited dose?
I attach the input files for the three simulations mentioned:
- alpha_1.inp (Simulation 1, i.e, both transport and delta-ray production cutoffs set to 1 keV)
- alpha_2.inp (Simulation 2, i.e., transport cutoff at 1 keV and delta-ray production cutoff at 10 keV)
- alpha_3.inp (Simulation 3, i.e., transport cutoff at 100 keV and delta-ray production cutoff at 1 keV).
alpha_1.inp (2.3 KB)
alpha_2.inp (2.4 KB)
alpha_3.inp (2.4 KB)
Thank you very much in advance for your help!
Best regards,
Lidia