Dear FLUKA experts,
I am trying to modelling my HPGe detector to calculate the efficiency calibration for different geometries.
In order to validate the model, I am comparing experimental measurements of my check source with my simulations.
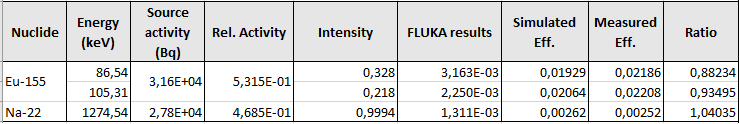
Starting with a simple front size configuration, the results have some discrepancy in lower energy, as you see in the follow table:
-
I suspect that the discrepancy in low energy range is related to my EMF cut setting. Could you check my input file to tell me if I’m setting something wrong?
-
I’m using source routine to simulate my check source with multiple radionuclides (Na-22 + Eu-155) with the relative activity fraction corrected for the radioactive decay. The original activity fraction was 50-50 %, while the actual which I implemented in source routine is: 53 % (Eu-155) and 47 % (Na-22). The source has cylindrical shape and matchs with the region called “active”. Given that the FLUKA results are normalized per total activity, I multiply them by 2 (the inverse of initial relative activity fraction) and divide by respective braching values.
Do I did any mistakes?
AEGIS.flair (5.0 KB)
AEGIS.inp (3.5 KB)
source.f (9.8 KB)
Thank You.
Regards
Corrado