Thanks for your explanation, it really helped a lot.
Could you also help me figure out and an explain, why the maximum and beginning values of energy deposition in water depends weakly on the increase of electron beam energy.
For this study, I performed two simulations for the case of a 22 MeV and 250 MeV electron beam.
It was calculated the energy depostion in the water along the beam in a volume of 0.1x0.1x0.1 mm3. The output from the source USERBIN card is attached (1Dose22MeV_21_01mm_00.dat and 1Dose250MeV_21_01mm_00.dat ).
The simulations results show that the maximum and beginning values of energy deposition in water almost the same.
So, I could not understand why increasing the beam energy does not affect the amount of energy deposited and what is wrong with my simulation?
If we look at the tables of stopping power and distance for electrons, we see that the radiating component increases 15 times for energies from 22 MeV to 250 MeV. This means that the number of photons produced in water increases, but this does not change the energy deposition values.
Please help me understand this effect and find what is wrong in my simulations?
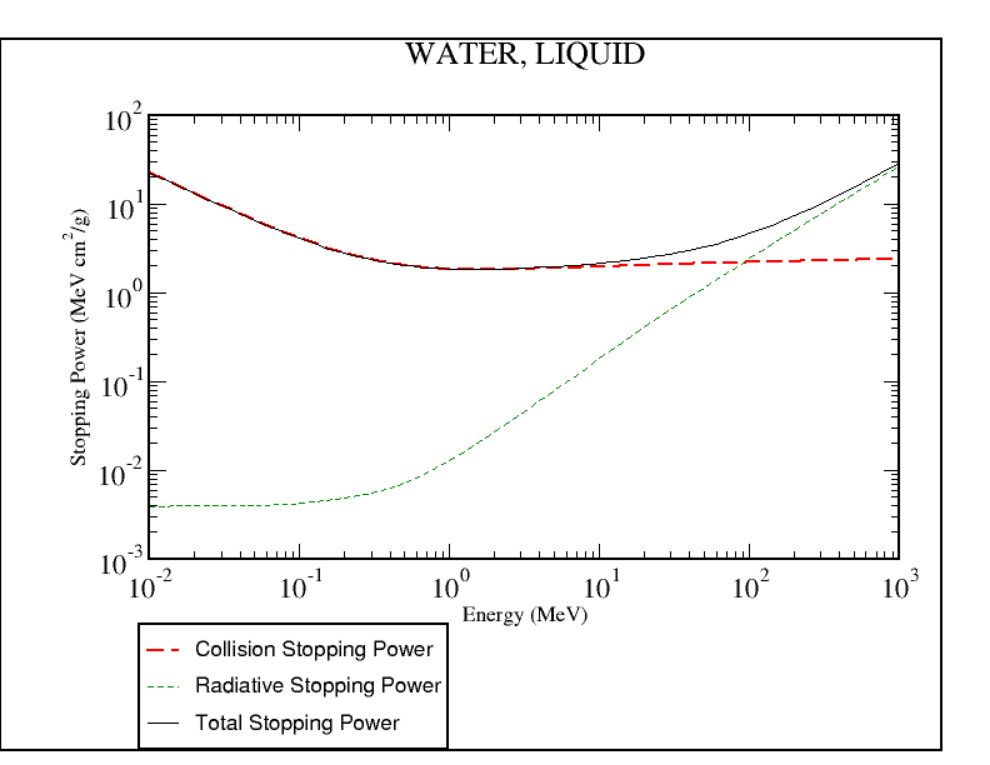
Before going into the details of your simulation, let’s consider in a bit more detail the stopping power in the plot below (see e.g. NIST ESTAR database):
Indeed, 22-MeV electrons are already past the minimum of the collision stopping power and into the logarithmic rise (i.e. slow / essentially flat in this scale). Thus, the collision stopping power for 22-MeV and 250-MeV electrons is fairly similar. It is therefore reasonable that when you look right at the onset of your geometry you see a fairly similar scenario in terms of energy deposition.
On the other hand, the radiative stopping power is drastically different, as you noted. Keep in mind, though, that these electron energy losses are invested in generating Bremsstrahlung photons. The latter will ordinarily travel deeper in your geometry (to eventually give rise to electrons e.g. via pair production, Compton scattering, or photoelectric effect, which will at some point deposit their energy), thus affecting the energy-deposition profile elsewhere in the depth of your geometry.
Indeed, if you look at what happens in the bulk of your geometry, the depth-dose profile is quite different under irradiation with 22-MeV or 250-MeV electrons.
Hope this helps!
Cesc
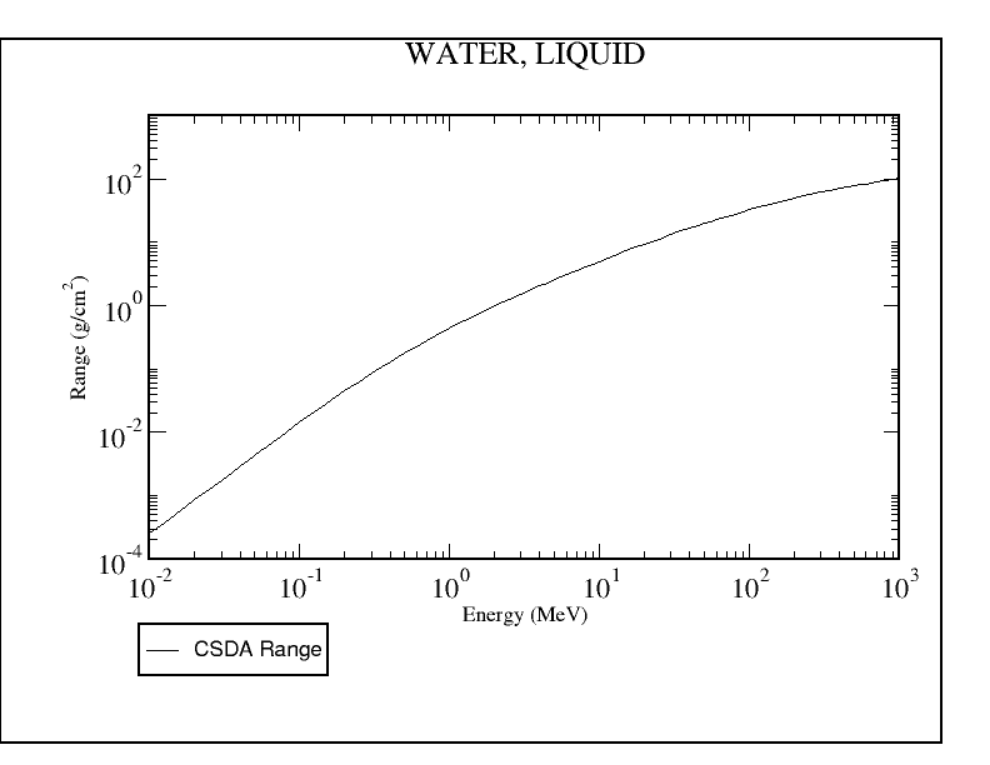
PS: i see your resolution in X and Y is in the order of 5e-3 cm. With your chosen DEFAULT you get an electron production and transport threshold of 100 keV. If you check out the electron range (also from ESTAR) you’ll get something like this:
100-keV electrons are expected to travel something like 1e-2 cm in water, exceeding your USRBIN resolution. One could still argue that along Z you have 1e-2 cm, but regardless, to be on the safe side it would be worthwhile to look into the EMFCUT card and set electron thresholds of, say, 30 keV. And to be terribly picky, reduce the photon production/transport threshold (otherwise 33 keV with your chosen DEFAULT) to, say, 10 keV, i.e. significantly below the electron production/transport threshold. The intention is to reflect the fact that at a given energy photons will travel farther than electrons.