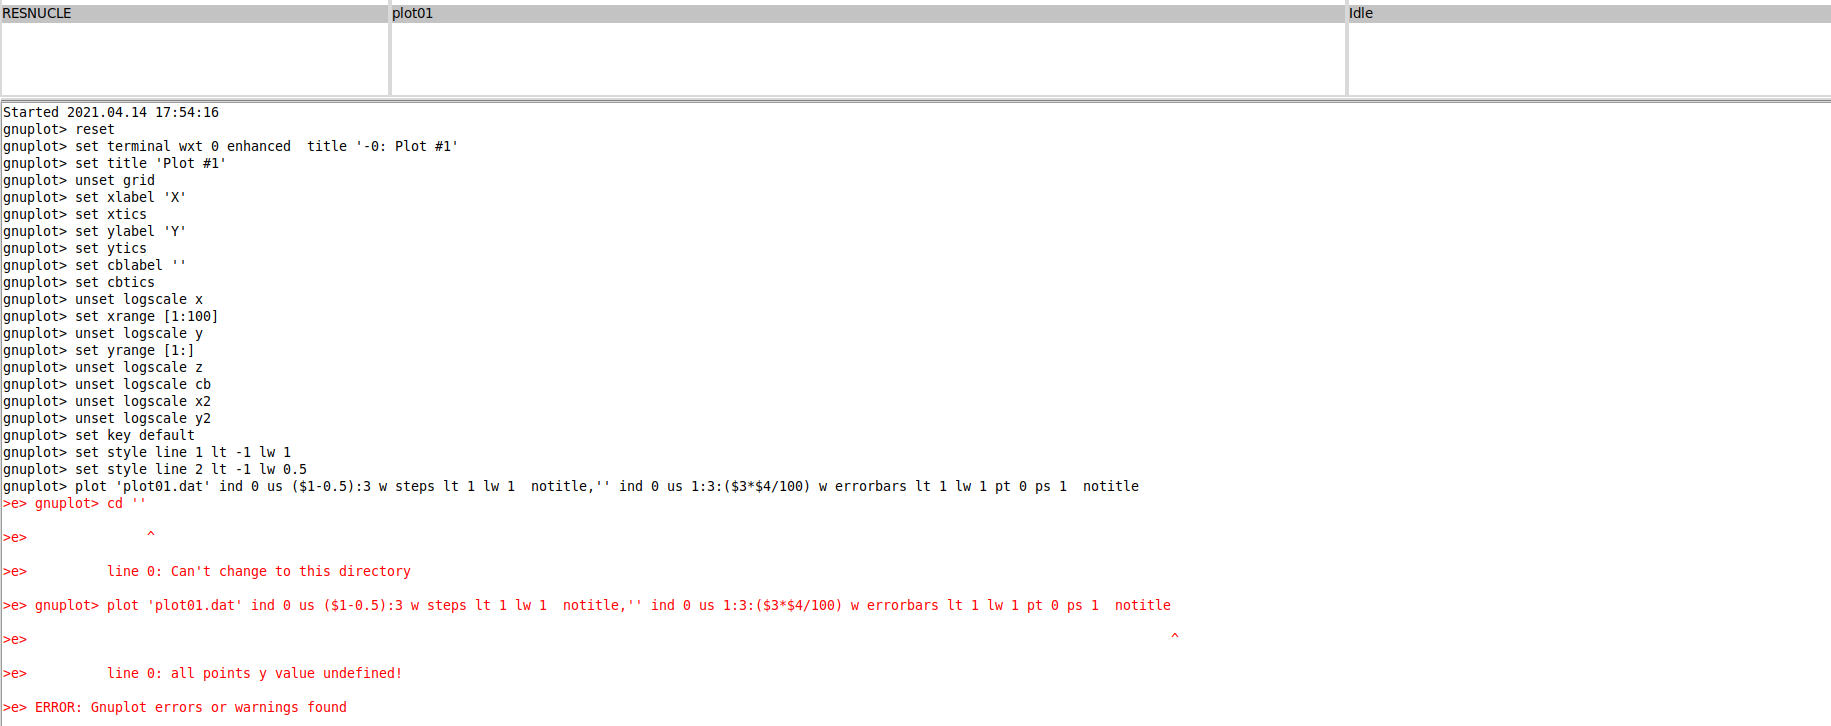
Hi! I try to obtain some resnuclei plot. But it shows just an empty plot. Tell please what is the problem ?
Here are .inp file and input data for plotting.
Photoyields.inp (2.1 KB)
Hi! I try to obtain some resnuclei plot. But it shows just an empty plot. Tell please what is the problem ?
Here are .inp file and input data for plotting.
Photoyields.inp (2.1 KB)
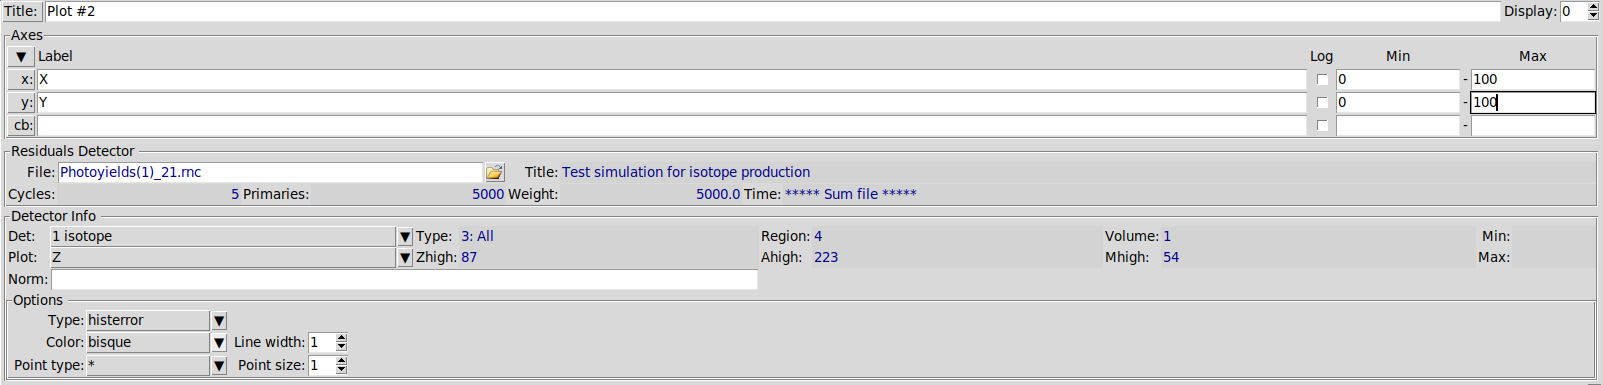
Hi, remove the y scale upper limit (you set to 100, which is by far too high, since - for the Z distribution you are trying to plot - the y axis represents the number of nuclei with atomic number Z that are generated on average by one incident photon) and you should see a two-peak distribution (at Z=83 and Z=1, with the latter coupled to Z=82, but lower than Z=82 since protons can leave the target).
Well, you added now 1 as lower limit on the y scale, which is again by far too high wrt your results: you are certainly not going to get one residual nucleus of atomic number Z per incident photon, rather something of the order of 1e-5 to 1e-4. Please remove the scale limits at all.