I am simulating proton’s impacting a tantalum target and I want to determine the cross sections for Tb isotopes. However, feeding from Tb precursors is occurring and this was noticed when looking at the experimentally measured cumulative cross sections.
The plot above is comparing instantaneous production from FLUKA therefore, I decided to add an irradiation time and decay/cooling times to the simulation to try to fit the data as much as possible to the experimental data.
Here is also 1 week irradiation time, but cooling is set to 1E5 seconds.
It seems that the production cross sections are decreasing over time but this feeding of the Tb isotopes is not occurring in the FLUKA simulation as compared to the experiment measurements.
Is there something else that I need to add to the FLUKA input besides the raddecay card to see the affect of Tb isotope feeding from its precursors?
the raddecay card + specification of an irradiation & cooling profile is sufficient to activate the feeding via decay.
Yet, this is indeed a bit of a tricky process that you are looking at. I don’t really know how you extracted the data from FLUKA that you are showing, but the experimental x-sec is a cumulative one which is mainly fed by Dysprosium. At first glance I have the impression that what you plotted could be the x-section of the direct production, which naturally will be too low when comparing to the cumulative experimental one. You would have to sum up the x-sec of all mothers that could lead to the respective Tb isotopes that you are looking at.
I did a quick verification with an inhouse activation code that is based on FLUKA and there I could verify that the majority of my Tb-149 in a Ta sample originates the decay of Dy-149 and Er-149 and some Ho-149 and Ho-149m. It is not exactly the same problem that you are looking at, but it shows that the feeding should work as expected.
Thanks you for your response.
Yes you are right, this is the just the Tb cross sections without summing the mother contributions. I did this because I thought that FLUKA would account for the feeding over time. So, I thought if I took the activity of Tb from FLUKA and calculated the cross section, the contribution due to the decay of the mothers would be included in this number (activity value). But, now I see that isn’t the case.
Actually it depends how you extracted the data. If you based it on the Tb activity + an irradiation/cooling profile then you should get the decay of the mothers into the Tb.
Yet, there is still the question of normalization. If you want to reproduce the data in the paper then I’d suggest to set up a simulation with thin targets and try to be as close to the experimental setup as possible.
For example, I think the authors used some foils and the activity created therein, to avoid the difficulty with the often not well known beam load.
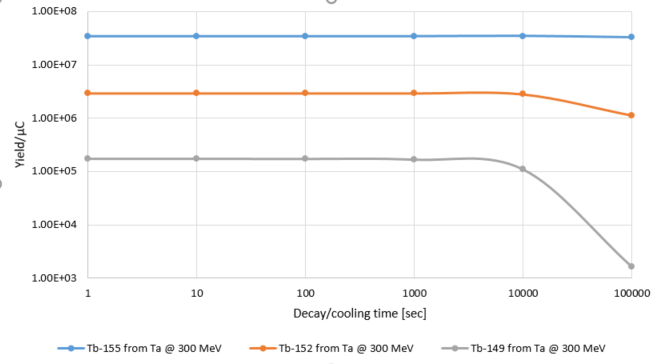
I’ve just taken the activity and converted it to yield/micro curie just to illustrate the issue I’m having. I’ve included an irradiation/cooling profile in the simulation and taken 300 MeV as an example.
You can see from the plot that Tb-155 barely changes however, Tb-152, and 149 decrease in yield. This tells me there is no feeding at all occurring. This I find strange since the irradiation time and decay time is clearly set in fluka when I check each of the sum.lis files generated from RESNUCLE.
I had a look and the Dy decays into Tb are in FLUKA’s decay database. So I think the problem should be somewhere else.
Could you post your input file and the sum.lis files that you used to create the plot above?
One possible mistake that I could imagine is that you might have taken the data from the table
** Isotope Yield as a function of Mass Number **
**** (nuclei / cmc / pr) **
Yet, this is the production data and in that case you will only have the direct production of the Tb! The data that you should use can be found in the tables with the heading
** Residual nuclei distribution **
**** (Bq/cmc) **
Sorry for the late response.
I think I was looking at the problem the wrong way. What I show in the plots is the time after irradiation.
But, production would go down for Tb as well as the mothers when the beam is switched off. So, now I am just looking at 1sec after 1 week irradiation (i.e. enough time for saturation to occur). Then, I can compare the instantaneous production and the production at 1 second after 1 week irradiation (bin_52 in the .inp file) to see the difference in build-up. I’m not sure how I will be able to relate this to the experimental data. All I know now is that if I increase the time after irradiation (cooling time) then isotope production will only go down anyway for Tb and it mother isotopes.
to be honest I am not sure if I am following you here regarding your latest post.
Yet, I had a quick look at your input and result files, and I think they are actually showing what one would expect. Look at Tb-155 and Dy-155 for example. You can see that the numbers of the Tb go up as soon as the Dy starts to decay. Admittedly, the two digits after the comma are not terribly precise to show this effect in detail, but it becomes visible. I did a quick ballpark estimate and the numbers seem to add up.
Tb-155
Dy-155
t1/2 = 459648.0s
t1/2 = 35640.0s
t
Bq
Bq
1
1.56E+10
2.73E+10
10
1.56E+10
2.73E+10
100
1.56E+10
2.73E+10
1000
1.57E+10
2.72E+10
10000
1.58E+10
2.42E+10
100000
1.52E+10
4.24E+09
The tricky thing is that the graphical representation of the effect is not terribly obvious when you want to look at Tb-155, 152 and 149 together due to the largely different half-lives.
Now, relating your simulation results to the experimental data is still another cup of tea. One would have to look in detail at the experimental setup.
If you allow me then I would also have some (minor) comments on the input:
concerning the physics cards the ones for EVAPORATION & COALESCENCE should be sufficient for your problem
no need to activate DPMJET and RQMD via the cards. Just use the executable which has both of the packages linked in.
your IRRPROFI card contains a beam intensity of 3.1211E15 protons per second(!) Maybe that’s correct but it looks like an awful lot to me.
I took the results given in the table that Chris extracted from your input. I took the Dy-155 activity after 1 second of cooling time, considering your cylindrical target of 0.5 mm thickness and 0.7 cm radius, as well as your 7 days of irradiation time and beam intensity of 3.15e15 p/s.
Therefore, I took the 2.7E10 Bq of Dy-155 and from this I get a cross section of 3 mb. If you look at the data in the publication link above, it is what I got from the experiment.
I did it with Tb-155 and 1E5 seconds cooling time with the activity calculated back to the end of beam, I also find the correct order of magnitude. But in your case, with 1E5 seconds of cooling time, you can’t compare with the data presented in this publication since Dy-155 won’t have fully decayed into Tb-155 after 1E5 seconds.
I would say that FLUKA is giving the good activity values. There might be an issue in your calculation process afterwards.
But I would also suggest the following to get closer from the experiment you are comparing your results with and be fully satisfied with what FLUKA gives you:
Reduce the thickness of your cylinder to 50 microns to make sure your cross section value can be considered as point wise.
Limit your proton intensity to few hundreds of nA to stay realistic and get activity values closer to the reality, except if you are building a 300 MeV/500 uA machine ;-).
Limit your irradiation time from 3 to 5 hours (to avoid the saturation of your Tb isotopes during irradiation).
If you are looking at Tb-149, Tb-152 and Tb-155 isotopes, make sure that their precursors have fully decayed into them in order to compare your cross section values with what can be found in the literature. To get the cumulative cross section of Tb-149, 2 hours cooling time will be enough. For Tb-152, 2 days will be safe. For Tb-155 let’s wait a full week.
Do not hesitate if you have any further questions,
Thanks you very much for your explanation, it helped a lot.
I re-simulated using your suggestions in order to get as close as possible to your experimental set-up.
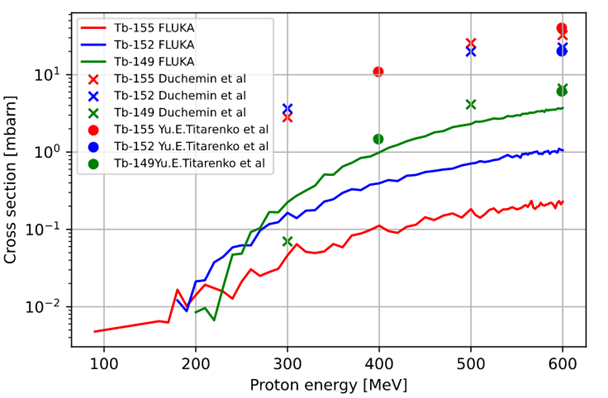
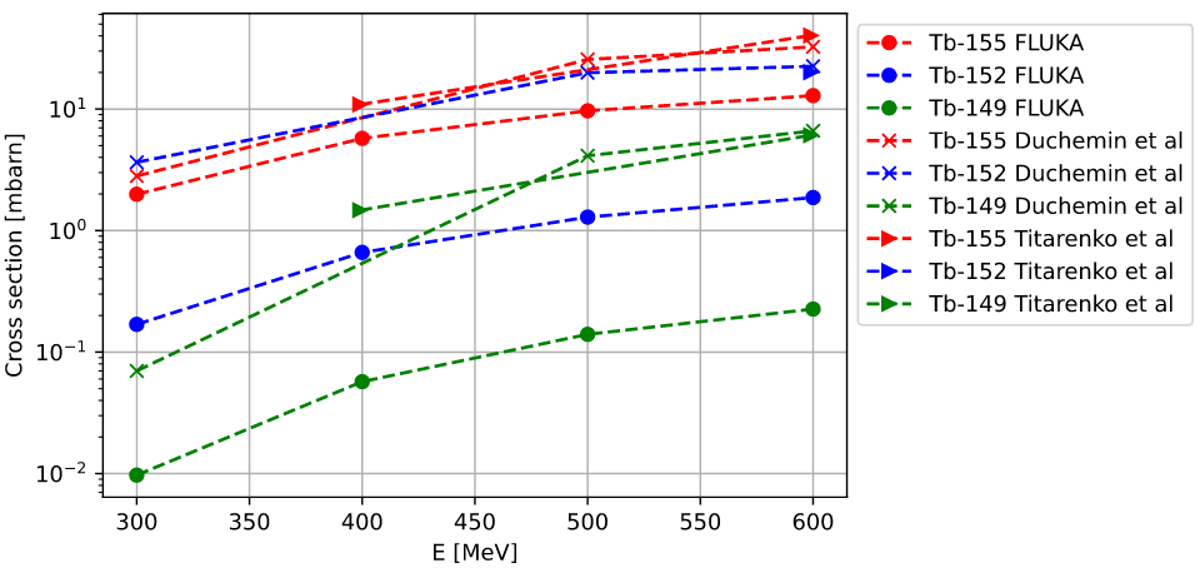
I’ve copied the FLUKA cross sections below along with your data.
FLUKA
300 [MeV]
500 [MeV]
600 [MeV]
Tb-155
1.33
6.81
9.00
Tb-149
0.11
2.26
3.53
Tb-152
0.16
1.46
1.85
Duchemin et al
300 [MeV]
500 [MeV]
600 [MeV]
Tb-155
2.81
25.6
32.5
Tb-149
0.07
4.13
6.62
Tb-152
3.65
19.9
22.5
As you can see there is still a rather large discrepancy. I am not sure how to explain this, would you know why?
Of course I know FLUKA will not always be able to give completely accurate cross sections when compared to experiment but I thought they might still be somewhat closer. Perhaps it would be best to look at yields, so I am going to integrate these cross sections to determine the in-target yields and make a comparison that way. If you like I can share the results.
I’m afraid I don’t understand what you mean. I don’t really understand why you would do this because I would have thought that scoring at the indicated cooling time would be the same as you would do it when measuring in the experiment?
Can you please explain to me how you would do this since this is quite new to me?
I think this discussion is now going a bit off-topic and diverging from the original FLUKA related question concerning the feeding by precursors. So I think we can close this topic, as this has been resolved.
What concerns your last question - you should keep in mind that one can do a gamma spec at any point in time, but the reported activities can be corrected for the decay that has occurred in the meantime. You should keep in mind that a production x-section cannot and must not depend on any decay period.