I am doing simulation of energy deposition per second by FLUKA.
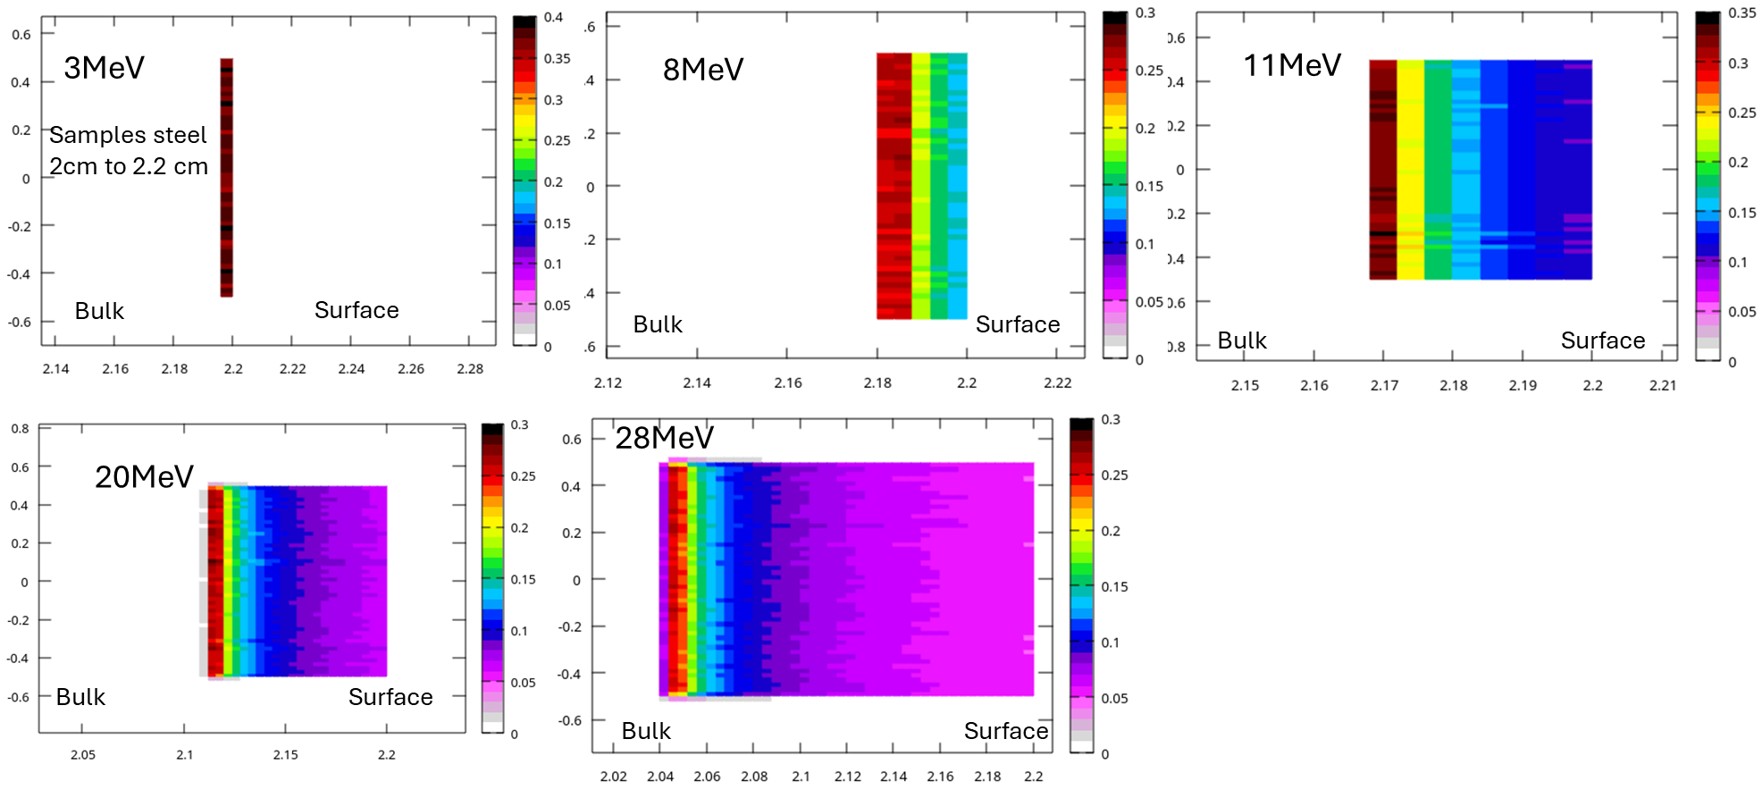
I have used proton energy as 3MeV, 8MeV, 11MeV, 20MeV and 28MeV for irradiation on Steel sample of 0.2cm thickness.
I get strange results, when the incedent proton energy is high the deposition energy is smaller near surface compare to bulk which make sense. It is not in case of low energy irradiation there the deposition energy is near surface but value is larger than high energy of proton irradiation.
Please help me in understing the error or mistake in my result
I believe the issue lies in the fact that you do not have sufficient resolution in the bins on the horizontal axis (i.e. the depth inside your target material with the beam coming from the right). Please try to reduce the bin size on the horizontal axis: this way you will see a difference with your original results. Note that what you are plotting is energy deposition density in discrete bins of your USRBIN scoring card, in units of [GeV/cm3], where the energy deposition value is divided by the USRBIN bin volume. Due to the fairly large bin size, you do not properly resolve the Bragg peaks for the proton beams at different energies, these however so show the correct behavior from a first glance.
Please try again with a finer resolution, you can e.g. keep the original USRBIN size but increase the number of bins on the horizontal axis. If this doesn’t work and the results are still unexpected, please share your .flair file to see what the remaining issues are.
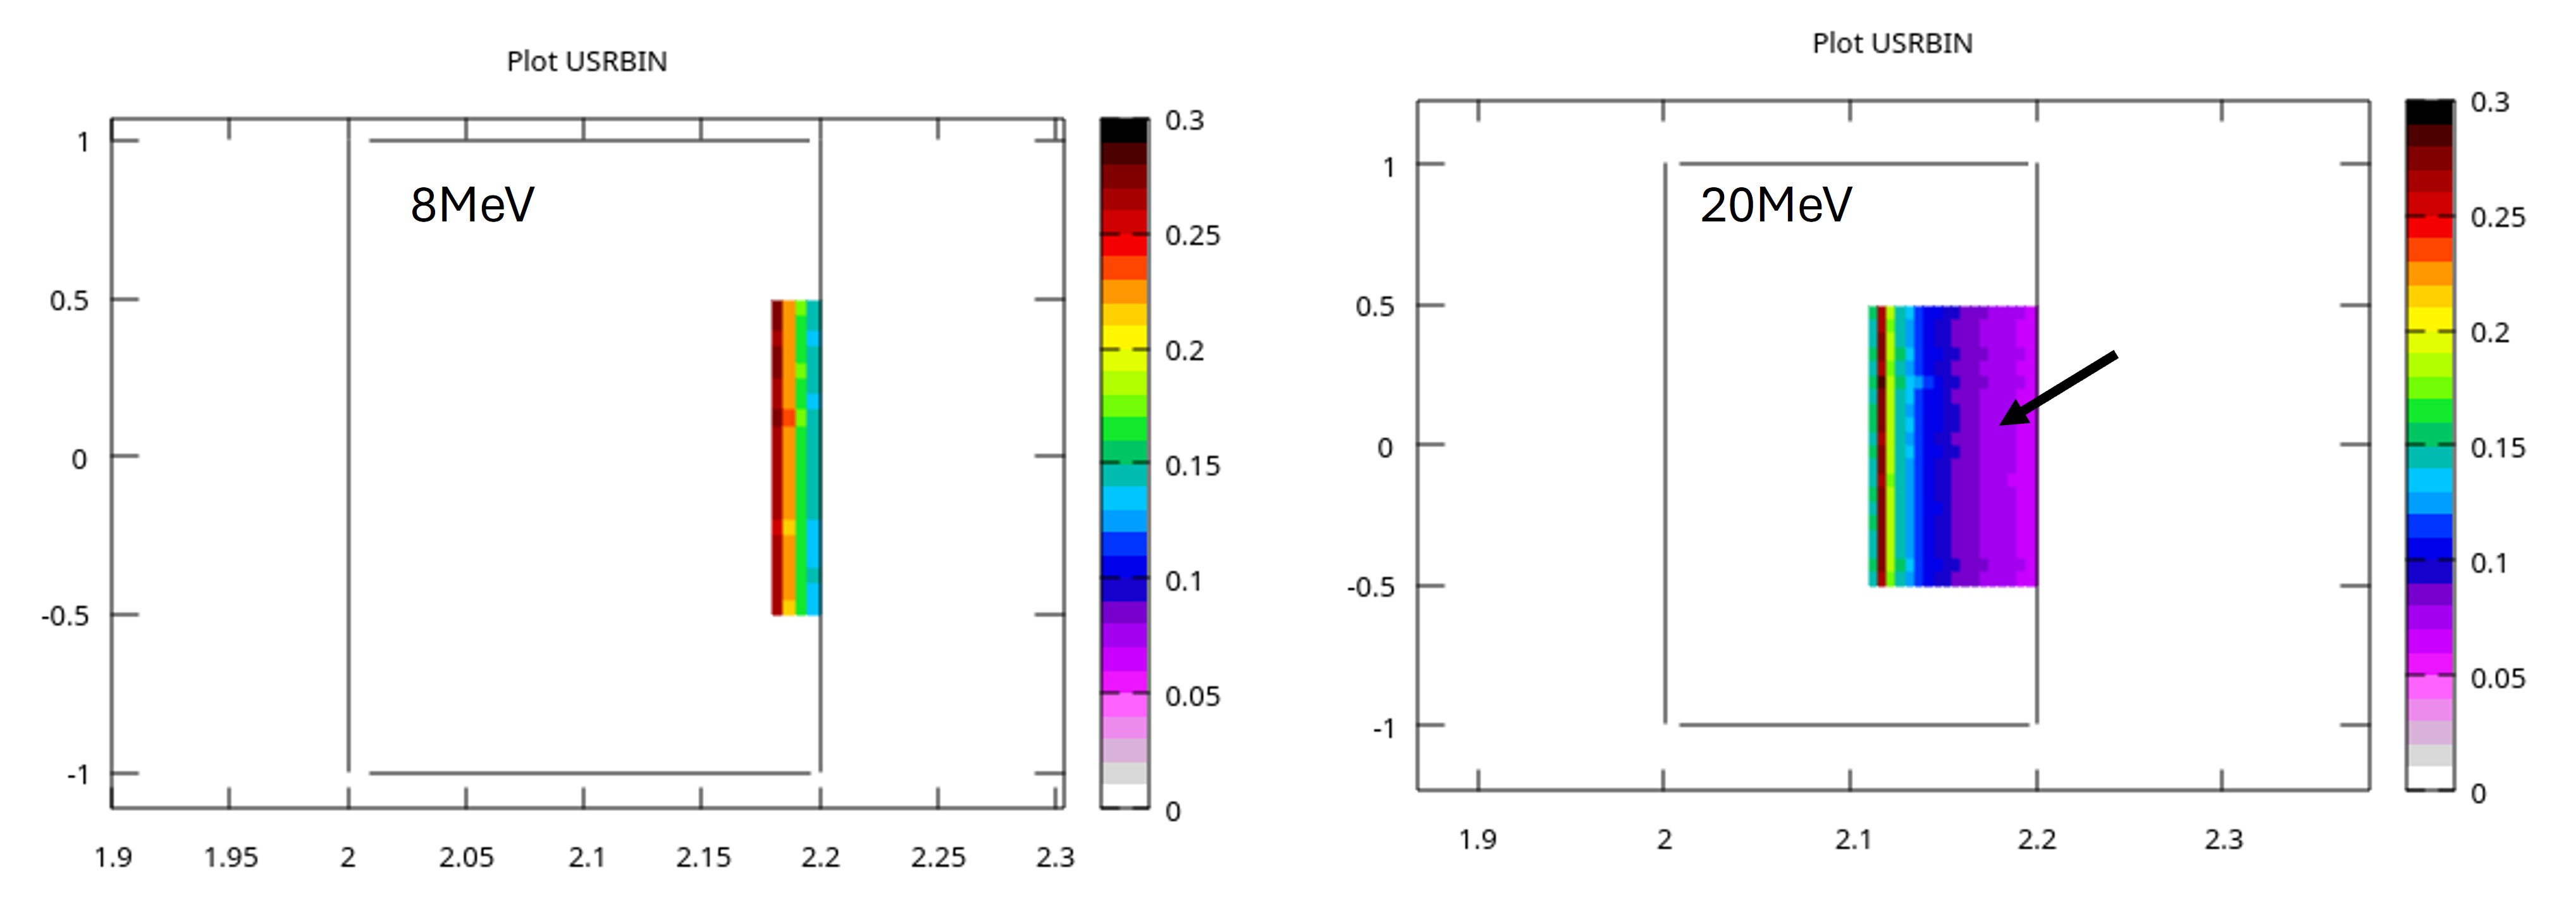
Thank you so much Andreas, for correcting me. I could find the correct plot (map) of energy deposition density by reducting the horizental axis bin size. But still I have doubt about the energy of incedent protons, incase of 20MeV the energy deposition is smaller (shown by arrow head) near surface than energy deposition in case of 8MeV.
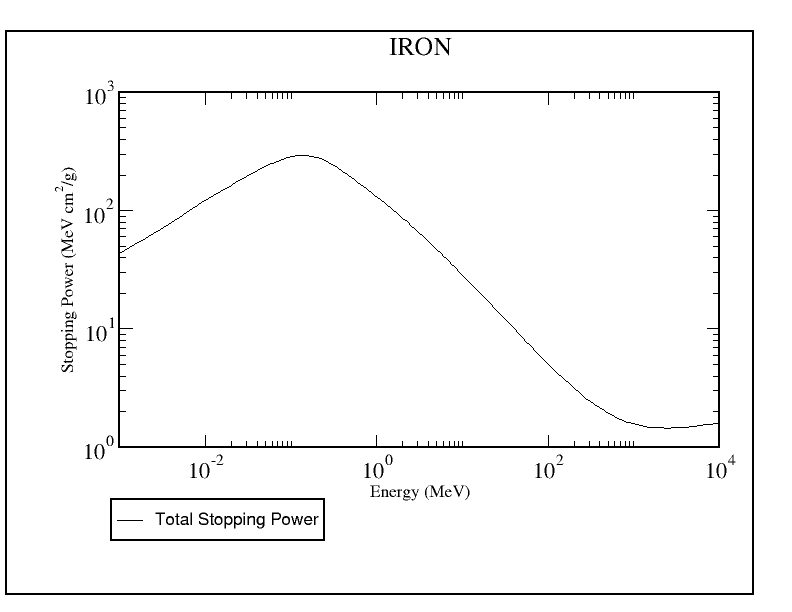
I believe this is nevertheless the correct behavior. To illustrate: The PSTAR database provides stopping power and range tables for protons in various materials. To simplify things, let’s assume that we look at the stopping power (or energy loss) of protons in the material iron only (the main atomic constituent of steel). PSTAR yields the plot attached below. If we would look at the surface, we would look at the stopping power of 8 MeV protons versus 20 MeV protons. As you can see from the plot, the stopping power (and hence the energy deposition in your target material) is higher for 8 MeV than for 20 MeV.
Thankk you so much for the nice discussion. I will consider the stopping power and related phenomena in the further calculations with the other energies.