The 9Be (d, n)10B reaction was simulated by Fluka software. The deuterium beam bombarded 9μm beryllium target with 1.45 mev of deuterium beam. The average deuterium loss on the target material was 504 kev, then I continue to increase the incident particle energy to 2 mev, deposition energy is only about 900 kev,
There is no question.
I understand that with mev you actually mean MeV.
You title that the deposited energy does not change with the deuteron energy and then you report that it actually does. In fact, a 800 keV deuteron deposits (almost) entirely its energy in your 9 um Be layer (and certainly not 10% more than its energy as you conclude), while a 2 MeV (or 1.45 MeV) deuteron is not stopped inside that layer and so deposits there only 390 KeV (or 504 keV).
Finally, note that to actually simulate the (d,n) reaction, a LAM-BIAS card is required to compensate for its unlikelihood in your thin foil.
Thank you for your answer. For thin targets, either 800 keV or 2,000 Mev, there is a partial loss of deuterium energy, and I am curious why, as the incident energy changes, the deposition energy is still around 900 keV.
Attach mine .inp file, in this file I have considered the LAM-BIAS card, do not know whether to add new data? ! Excuse me. Thank you! input dbe BSA2.00.inp (4.7 KB)
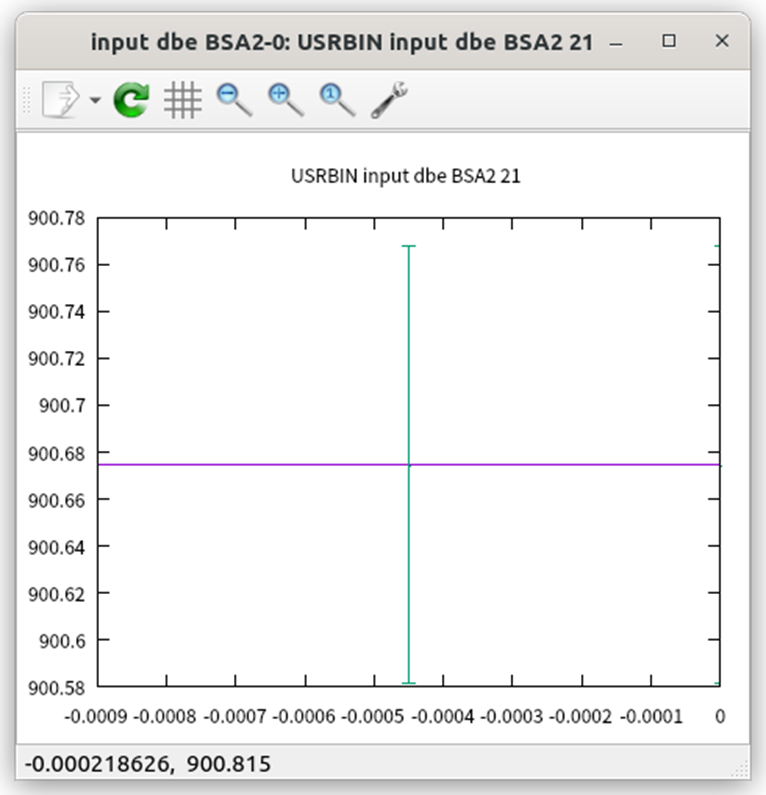
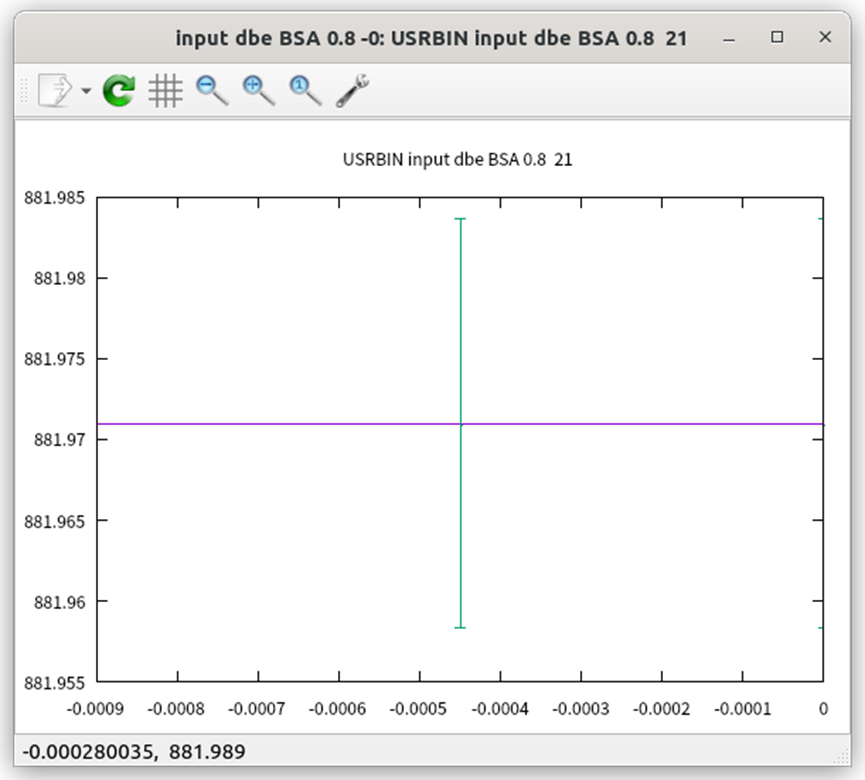
It’s not. As I indicated above, a 800 keV deuteron loses all its energy (that is 800 keV and not 900 keV) in your Be layer, while a 2 MeV deuteron deposits there only 390 keV.
I wonder how you erroneously conclude that in both cases the energy deposition is 900 keV, since in your input there is no scoring card evaluating energy deposition (rather deuteron fluence). You should add a USRBIN scoring ENERGY per Region, or you can look at the region table towards the end of the standard output file.
Moreover, note that PHYSICS/PEATHRES and PHOTONUC are pointless, PART-THRES cannot accept 1 eV (which is automatically raised to the minimum value of 2 keV), and the biasing value you put in LAM-BIAS is by far too small (0.0001 is a meaningful choice such as to artificially reduce the deuteron inelastic scattering length, printed in the output file, down to your layer thickness order of magnitude).
Thank you very much for your reply! I modified my input file and the deposited energy results are consistent with the reference paper. But I also have a new problem is that the neutrons produced by D-be reaction are mainly in the low energy region. The neutron flux-energy relation graph drawn by Fluka software is not obvious in the low energy region,
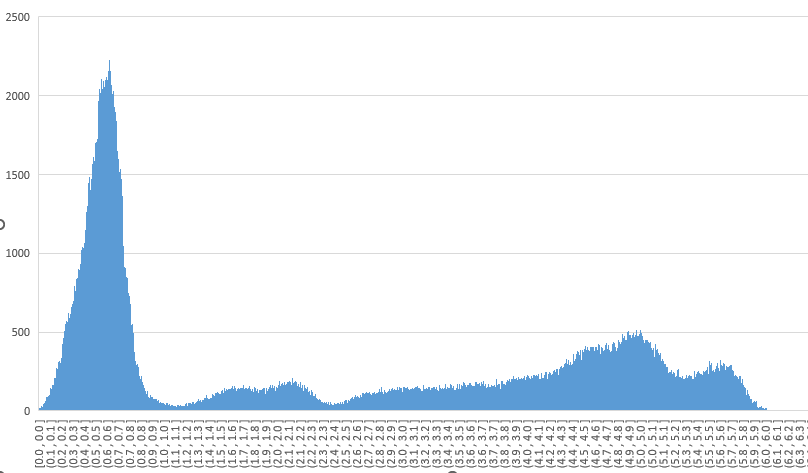
when the 1.45 MeV incident deuterium that I simulated in the Geant4 software bombards the 1mm-thick target material, there are obvious neutron peaks. This is a neutron counting image.
The FLUKA software also simulates 1.45 MeV incident deuterium bombardment of a 1mm-thick beryllium target. Are there low-energy neutrons that the Fluka software doesn't record? Or is there something wrong with my input file? Thank you for your reply! input dbe BSA3.1.inp (4.7 KB)
The neutrons not recorded by your FLUKA scoring at the Be-W boundary are just the ones below 500 eV, due to the low energy cut you put in USRBDX. These < 500 eV neutrons are not direct products of the d+Be reaction, but come from re-interaction with the surrounding material.
A peak at about half a MeV is present also in the neutron spectrum from FLUKA. Note, however, that your plot above displays this peak excessively suppressed with respect to what one actually obtains by running your own input file. Differences from the Geant4 spectrum may derive from different (d+Be) reaction implementations.
As for your input, the BIASING card makes no sense and LOW-PWXS should be left blank to apply to all materials.
As you said, I changed some parameters in the input file, and the peak at 500 keV was a little higher, but still not significant compared to other peaks. Is it the different reactions to the input D-Be? Is there any other solution?
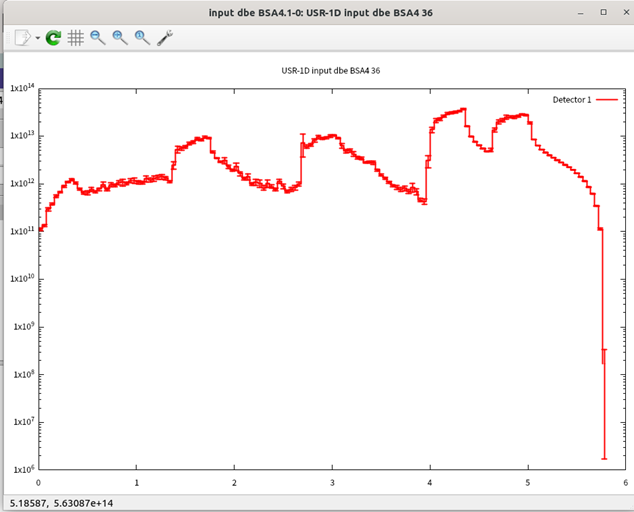
As shown in the following figure. This is the neutron energy spectrum of the simulated 1.45 MeV hit 9μm thin target, and the deposition energy is about 504 keV, which is consistent with the references. I hope you can answer my questions, thank you very much ~ !
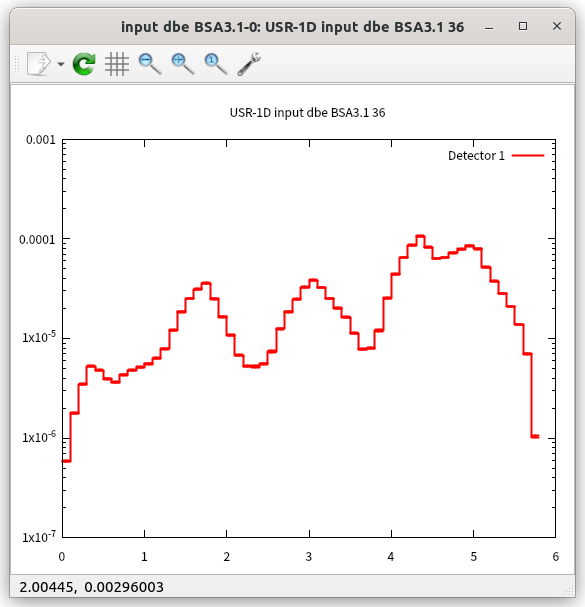
This is because, although your figure does not report the axis quantities and units, you plot dN/dlog(E) ( = E dN/dE, i.e. <X>*Y in the Flair Plot frame), which makes no sense for a linear energy scale/binning.
Just plot dN/dE (i.e. Y), as it should be in this case, and the half MeV peak will appear with the others at the actual height.
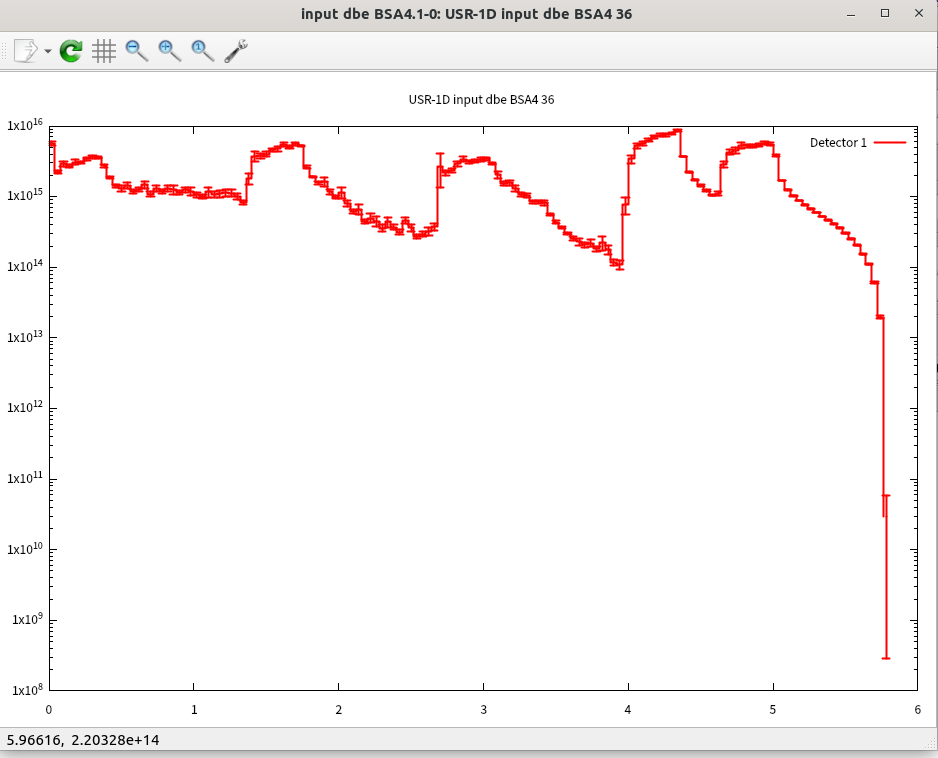
Thanks for the answer. I never understood the difference between Y and <X>*Y, and the graphs they drew (especially the values on the y axis) were quite different. Here is my redrawn dN/dE (i.e. Y) image.
Then this is the type I have chosen, 9.36e16 represents the number of electrons per second in a 30 mA deuterium beam current.Thank you very much for answering many of my questions.
Well, I’m afraid this has definitely to be well understood, since one has to know which quantity (s)he’s actually plotting. Obviously dN/dE (which is the FLUKA result, i.e. Y) by definition is not the same as EdN/dE (which is dN/dlog(E)). The plotting selection is dictated by the adopted energy scale/binning on the X axis: if the latter is linear, on the vertical axis it should be dN/dE (Y); if it is logarithmic instead, it should be dN/dlog(E) (<X> * Y). You may want to carefully look at the training slides (7-12).