Dear Ma Yiyi,
I wonder know the meaning of the threshold of transport and PRO-CUT represent in EMF cards.
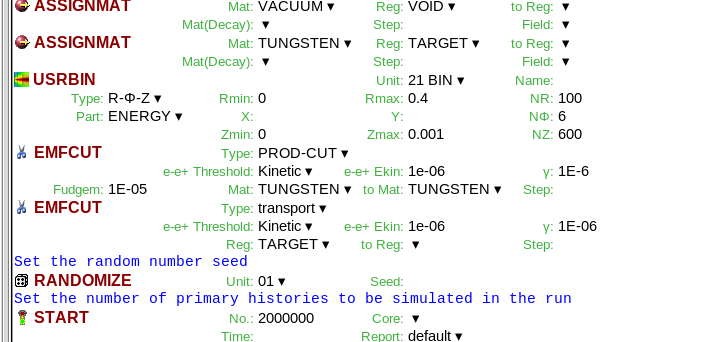
Charged particles moving in a medium undergo plenty of collisions with target electrons. If sufficient energy is transferred to the target electron, it is explicitly produced as a secondary and may be considered for transport (these electrons are then called delta rays). The delta-ray production threshold (what you prescribe in the EMFCUT card with SDUM = PROD-CUT) is the energy above which electrons are explicitly produced during such collisions.
Instead, the transport threshold (which you set with the EMFCUT card and blank SDUM) is setting the lowest (total or kinetic) energy down to which electrons/positrons or photons are tracked in the geometry. Below that cutoff their energy is deposited on the spot.
Is it the threshold representing the first ionization energy?
No.
So how do I set these thresholds according to my needs, or use FLUKA’s own default thresholds?
You need to set production and transport thresholds such that you track electrons down to an energy for which their range is comparable to the spatial resolution of your USRBINs and/or your geometry.
For instance, in the input that I used for the previous reply, the spatial resolution along z was 2 µm. This corresponds to the range of ~30 keV (see again https://physics.nist.gov/PhysRefData/Star/Text/ESTAR.html). So you may safely set production/transport cuts of say 10-30 keV. Putting even lower cuts shouldn’t affect much the resulting energy-deposition spectrum (you would waste time sampling electron trajectories and resolving details in a scale much shorter than the 2 µm bin width).
Note that FLUKA provides default values. For instance, if you use a DEFAULTS card with PRECISIOn you’ll get cuts of 100 keV for electrons/positrons and 33 keV for photons. These values are not necessarily suitable for all scenarios. The recipe to set them is basically to follow the reasoning above for whichever situation (scoring resolution and geometry size) you find yourself in.
For more details you can consult the following material: https://indico.cern.ch/event/1012211/contributions/4247798/attachments/2258115/3832065/09_EM_ionisation_transport_2021_online.pdf.
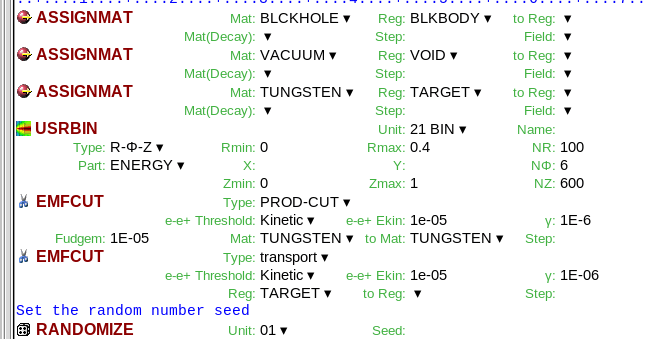
I used FLUKA’s default, 10eV energy threshold and 8 eV energy threshold for calculations.
I understand there was a typo in the units, you meant keV instead of eV.
I found some differences.
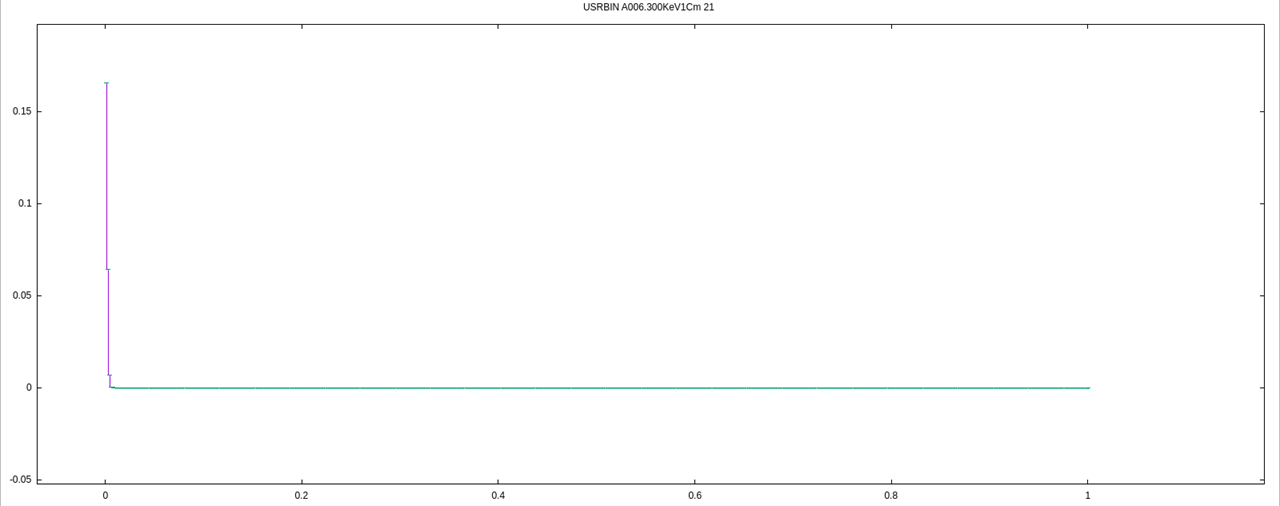
Of course. The default cuts of 100 keV are too coarse for your chosen scoring resolution. 100 keV electrons (look up their range in the NIST ESTAR database link above) can physically travel further than 10 µm - which is the depth along z up to which your USRBIN is extending. However, with 100 keV cuts you are depositing their energy on the spot. This is why your curve labeled “DEFULT” lies somewhat above the other two curves.
Instead, the difference between the 8 keV and 10 keV cuts curves is basically nonexistent since the range corresponding to either of these energies is shorter than (or of the order of) the spatial resolution.
what is the physical meaning of the calculated energy deposition?
What you are scoring is the result of two mechanisms:
-
Transported electrons take finite step sizes. Along these steps, they lose energy in a continuous manner as per a (restricted) stopping power (dE/dx) resulting from many collisions with target electrons with a transfer of energy below the production threshold. No delta ray is generated here. The aggregate energy loss is scored into the corresponding bin as electron trajectories are sampled.
-
Electrons dropping below transport threshold deposit their energy locally, and thus also contribute to your scoring.
Of course you also have delta rays being produced and tracked as a result of collisions with target electrons with energy transfer above production threshold. These are tracked (depositing energy continuously as per the first point above) and when their energy drops below transport threshold they deposit energy locally, hence also contributing as per the second point above.
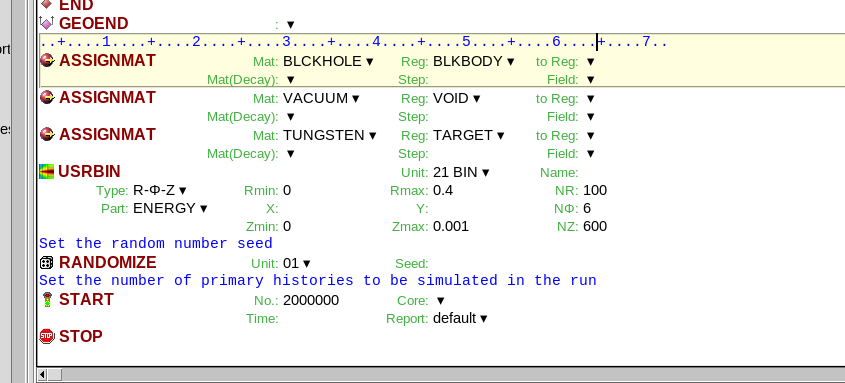
When you are scoring ENERGY with a USRBIN card, what you obtain is actually a quantity with units of GeV/cm^3/primary. So, there is a normalization by the bin volume, leading in fact to an energy deposition density. For a more complete picture you can have a look here: https://indico.cern.ch/event/1012211/contributions/4247796/attachments/2257010/3829959/08_Scoring_I_2021_online.pdf and here: 7.22.87. USRBIN — FLUKA Manual.
Is it the energy deposition of a single electron at a certain point?
No.
Besides, could you please send the inp file you have run to me?
Yes, here it is:
electron_beam_on_W.inp (1.3 KB)
Cheers,
Alexandra