We are running a simulation to obtain the energy distribution of delta-ray electrons produced by primary accelerated protons injected into a thick-target source with solar atmosphere composition. The primary protons are assumed to have a downward isotropic angular distribution and a power-law energy distribution of spectral index delta = 4 in the range from 1 MeV to 1 GeV. Attached are the input file and the routines used in the simulation:
source.f – generates the energy and angular distributions of primary protons.
mdstck-k.f – selects only the delta-ray electrons generated by protons.
mgdraw-k.f – writes the kinetic energies (at time of production) and weights of delta-ray electrons to a file.
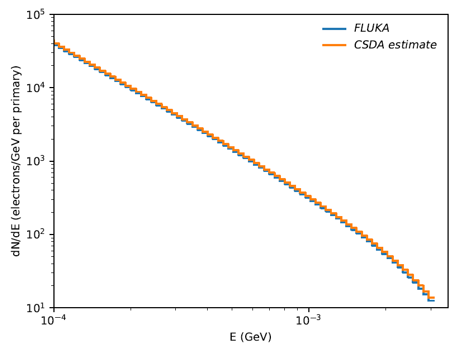
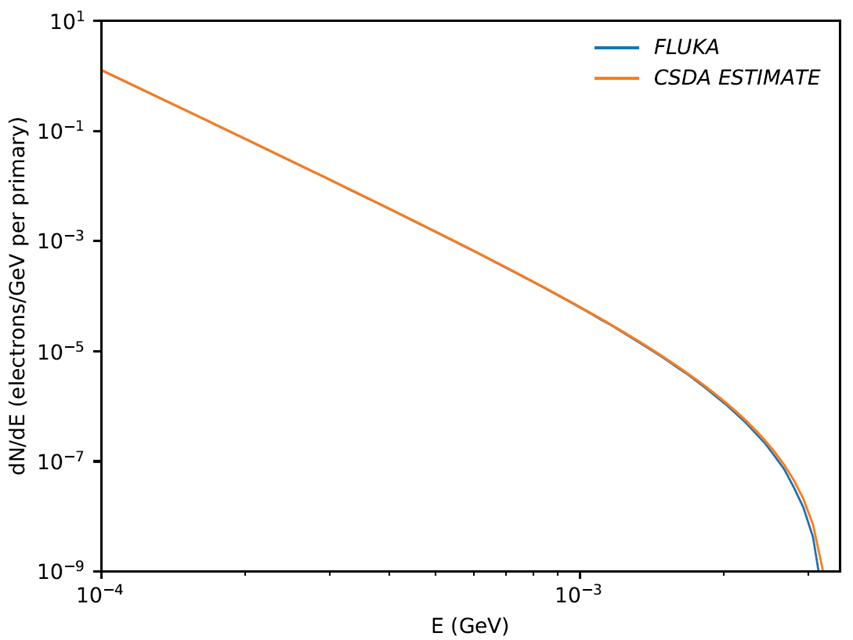
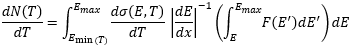
Using a Phyton code, we obtained the energy distribution of delta-ray electrons above a production threshold Tcut = 100 keV (set by using the DELTARAY card). The result was compared with an estimate based on a continuous slowing down approximation (CSDA), given by:
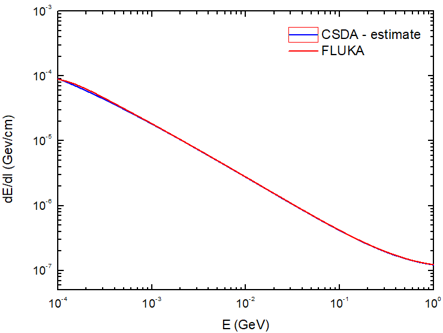
where dσ(E,T)/dT is the differential cross section for delta-ray production, dE/dx is the proton energy loss rate in the target given by the Bethe-Bloch formula (with the spin term included but no higher order corrections) and F(E) is the energy distribution of primary protons. We checked that the tabulated values of the effective energy loss rate used by FLUKA agree closely in the relevant energy range with the Bethe-Bloch expression used in the CSDA estimate. For a more consistent comparison, we suppressed several processes which are not accounted for in the CSDA estimate (such as elastic and inelastic scattering, multiple Coulomb scattering, proton bremsstrahlung/pair production, Moller/Bhabha scattering, etc.) and discarded particles that could also produce delta-ray electrons.
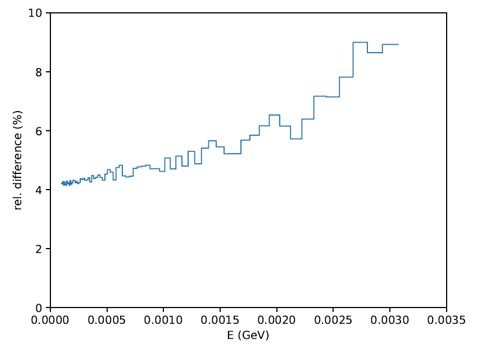
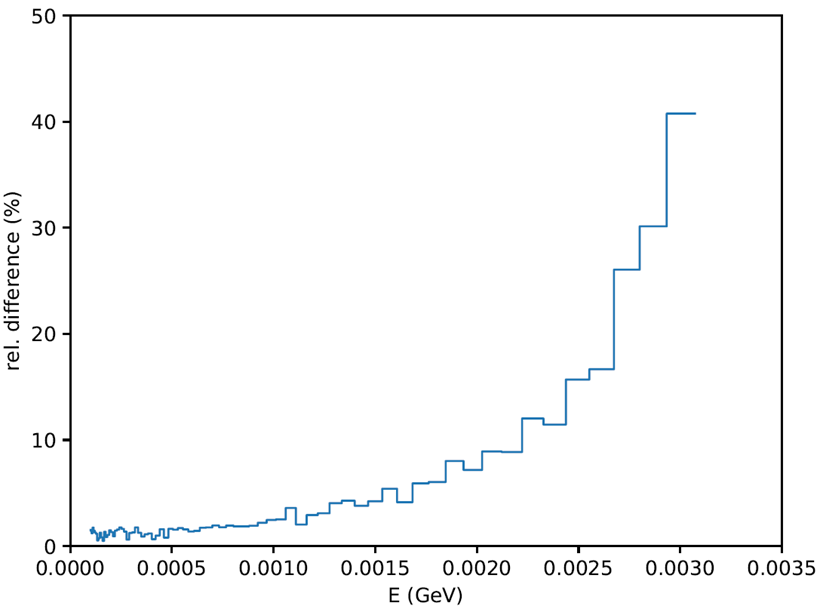
The FLUKA result for the energy distribution of delta-ray electrons and the CSDA estimate have a similar shape. Quantitatively, however, there is a difference which increases with energy.
We would be grateful if you could check the setup of our simulation and for any help understanding the remaining discrepancy between the FLUKA result and the CSDA estimate.
From the side of the simulation i do not spot an obvious error in your train of thought / input / subroutines at first glance.
The result was compared with an estimate based on a continuous slowing
down approximation (CSDA), given by:
Unless I am missing something, there appear to be dimensionality issues with this expression: in the right-hand side one has dimensions of L^3, i.e. (Length)^3, of which L^2 come from the differential cross section and a further L from the inverse stopping power. The left-hand side quantity is therefore not a distribution of delta ray energies T in units of 1/T. This will most likely not be the culprit, but it is still worthwhile revisiting its derivation for the sake of consistency. Formally, one would like to have an integral which (proper normalization factors aside) should look like this:
       oo
dN     /     d sigma(E,T)
--  ~  | d E ------------  g(E),
dT     /         d T
       0
where g(E) is proportional to the probability of finding a proton of energy E.
We checked that the tabulated values of the effective energy loss rate used by FLUKA agree closely in the relevant energy range with the Bethe-Bloch expression used in the CSDA estimate.
I was at first naively suspecting that the lack of energy-loss fluctuations in the CSDA might be responsible for the differences you witness at high delta-ray energies (strongly suppressed and far away from the average delta-ray energy which is instead much lower and reasonably described).
But before further elaborating along these lines, it may be good to first exclude any other possible systematic discrepancies. Could you make sure that there is no inconsistency between the dsigma(E,T)/dT you are using and that of FLUKA? E.g. by:
Restricting your primary proton energy to 1 GeV (these are the protons that manage to occasionally transfer a maximum recoil energy of ~3.3 MeV to delta rays).
Writing out delta-ray energies only if the proton kicking them out has an energy still reasonably close to 1 GeV (to be tried but, say, from 0.95 GeV to 1 GeV). You can simply filter by proton kinetic energy via ETRACK-AM(1). This may be a bit time consuming but probably worth it.
Comparing their spectrum with the expression you use for dsigma(E=1 GeV, T)/dT.
We checked that the tabulated values of the effective energy loss rate used by FLUKA agree closely in the relevant energy range with the Bethe-Bloch expression used in the CSDA estimate
One should also first exclude that any systematic difference here is not contributing. How closley did the two stopping power estimates agree?
1 - "Unless I am missing something, there appear to be dimensionality issues with this expression: in the right-hand side one has dimensions of L^3, i.e. (Length)^3, of which L^2 come from the differential cross section and a further L from the inverse stopping power. "
The dimensions are correct (I appologize for not providing more details in my previous post). In the expression
,
stands for the differential cross section per atom, given by
and stands for the mass stopping power multiplied by , ie.
2 - “How closely did the two stopping power estimates agree?”
The relative differences for primary proton energies in the range from 1 MeV to 1 GeV are less than 1 %.
3 - “Could you make sure that there is no inconsistency between the dsigma(E,T)/dT you are using and that of FLUKA? E.g. by
Restricting your primary proton energy to 1 GeV (these are the protons that manage to occasionally transfer a maximum recoil energy of ~3.3 MeV to delta rays).
Writing out delta-ray energies only if the proton kicking them out has an energy still reasonably close to 1 GeV (to be tried but, say, from 0.95 GeV to 1 GeV). You can simply filter by proton kinetic energy via ETRACK-AM(1) . This may be a bit time consuming but probably worth it.
Comparing their spectrum with the expression you use for dsigma(E=1 GeV, T)/dT .”
If I understood correctly, the calculation you suggested will not give dsigma(E=1 GeV, T)/dT but the energy spectrum of delta-ray electrons produced by 1 GeV primary protons as they slow down to 0.95 GeV:
Thanks for correcting this now wrt to your original post (it was otherwise ambiguous).
If I understood correctly, the calculation you suggested will not give dsigma(E=1 GeV, T)/dT but the energy spectrum of delta-ray electrons produced by 1 GeV primary protons as they slow down to 0.95 GeV:
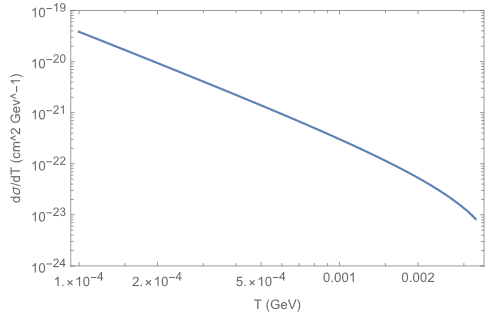
The exercise above was meant to compare the spectral shape of dsigma(E=1GeV,T)/dT in FLUKA, against that of your evaluated dsigma(E=1GeV,T)/dT (raw, as is, no integral) to exclude discrepancies in this integrand to possibly be the culprit for those reported in the first post.
Certainly, filtering by proton energies you will necessarily have to accept a certain proton energy range [Ea, 1 GeV] when writing out delta-ray energies for building their spectrum/histogram. To pick Ea you may plot/monitor your raw dsigma(E,T)/dT at E=1 GeV and examine what Ea you can still reasonably accept such that Tmax is still well above say 3 MeV and that the shape of this differential cross section is not substantially different, particularly towards delta-ray energies above 2.something or 3 MeV: it suffices for differences to be smaller than the 30-40% you observe on your original post spectrum.
Instead, if the exercise (reasonably adapted as need be) is feasible and things match reasonably, I can think of two possibilities (which if found satisfactory you may spare yourself the exercise above):
In the CSDA, the proton loses a well-defined amount of energy given by the stopping power (the average energy loss per unit path length): the distribution of energy losses of the proton is, implicitly, a Dirac delta at average energy loss for its present energy. No variance, no skewness, no kurtosis, and no higher-order moments/cumulants, that is, no energy-loss fluctuations (present instead in the simulation!). This analytical approximation should therefore be fine to effectively describe the (greatly dominating) small energy losses: the average energy loss should itself be relatively small. Instead, larger energy losses (i.e. delta rays produced with large T, which gradually become accessible as the proton energy increases) at the progressively suppressed tail of the distribution might fail to be well captured.
For a proton with E=1 GeV taking a small step (these are the protons we care about here since they are the ones that can lead to T near 3.3 MeV where you spot issues), the CSDA prescribes its energy at the end of the step as Ecsda=E-Wavg, where Wavg is implicitly given by the usual stopping power integral, whereas in the simulation (with fluctuations) one has Esim=E-Wavg-Wfluc, possibly/easily leading to Esim<Ecsda (if the energy loss is at the tail!). Since the distribution of energy losses has a tail towards the larger (not the smaller) energy losses, this is well possible. Thus, the simulated proton can easily arrive at delta-ray production with a (physically meaningful!) Esim<Ecsda, leading to a smaller Tmax wrt CSDA, leading to less intensity at large T in your simulated spectrum, and possibly explaining the observed discrepancy.
In a nutshell: you could simply be witnessing a direct implication of the lack of energy-loss fluctuations in the CSDA.
Some other assumption in the derivation of your quoted expression breaking down.
I modified the setup of the FLUKA simulation to carry out the exercise you suggested:
Restricted the primary proton energy to 1 GeV (by setting WHAT(1)=2 in the source card).
Recorded delta-ray kinetic energies only for parent protons with kinetic energies in the range from 0.99 to 1 GeV. This is implemented by the following lines of code in the mgdraw-k.f routine (entry USDRAW):
IF (ICODE.eq.103) THEN
  DO ip=1,Np
   IF(kpart(ip).eq.3)THEN
   eprim=etrack-am(1)
   IF(eprim.ge.0.99.and.eprim.le.1.0)WRITE(50,*) tki(ip)
   END IF
  END DO
END IF
The intensity of the simulated delta-ray spectrum obtained this way is not consistent with that of the evaluated cross-section dσ(E=1 GeV,T)/dT , which is shown below:
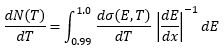
The simulated spectrum matches reasonably well, however, to that obtained from
The relative differences are less than 10%. So, as you pointed out, it is most likely that the discrepancy is due to the lack of energy-loss fluctuations in the CSDA estimate.
 ,
,