Dear FLUKA experts!
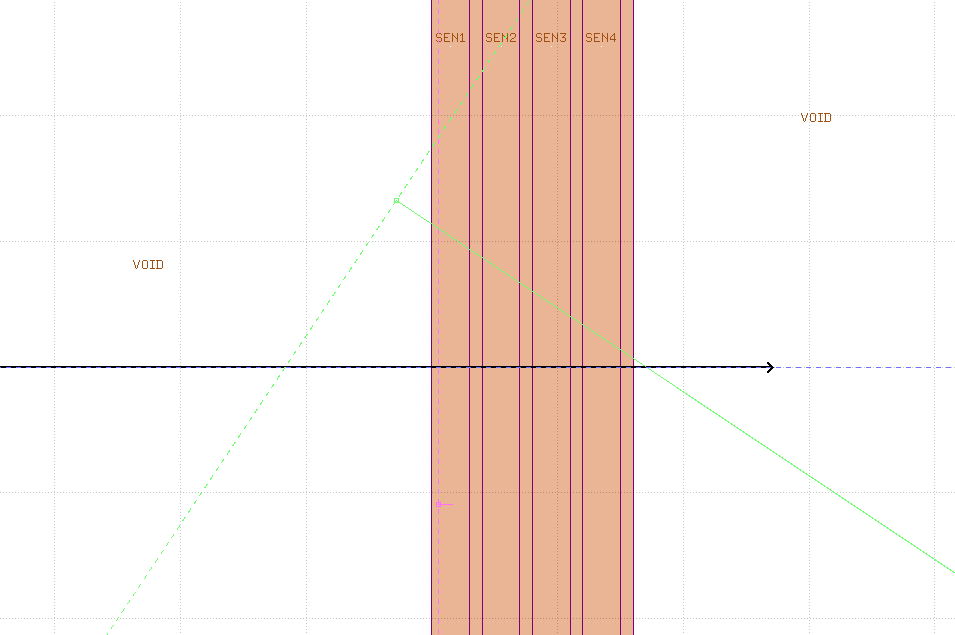
I have a basic setup with a few silicon layers in a row (see pic below). Some of them (SEN1-4, 300 um thick) are used for scoring energy loss via DETECT card (sensitive regions) and some are non sensitive with a 100 um thickness.
I am calculating various setups (1 layer of silicon, several layers of silicon etc) with initial particles as protons with 1 GeV energy and heavy ions, namely Fe with energy 1 GeV/n.
In the setup, where I have all the layers enabled, with a proton as initial beam particle, I am obtain such plot:
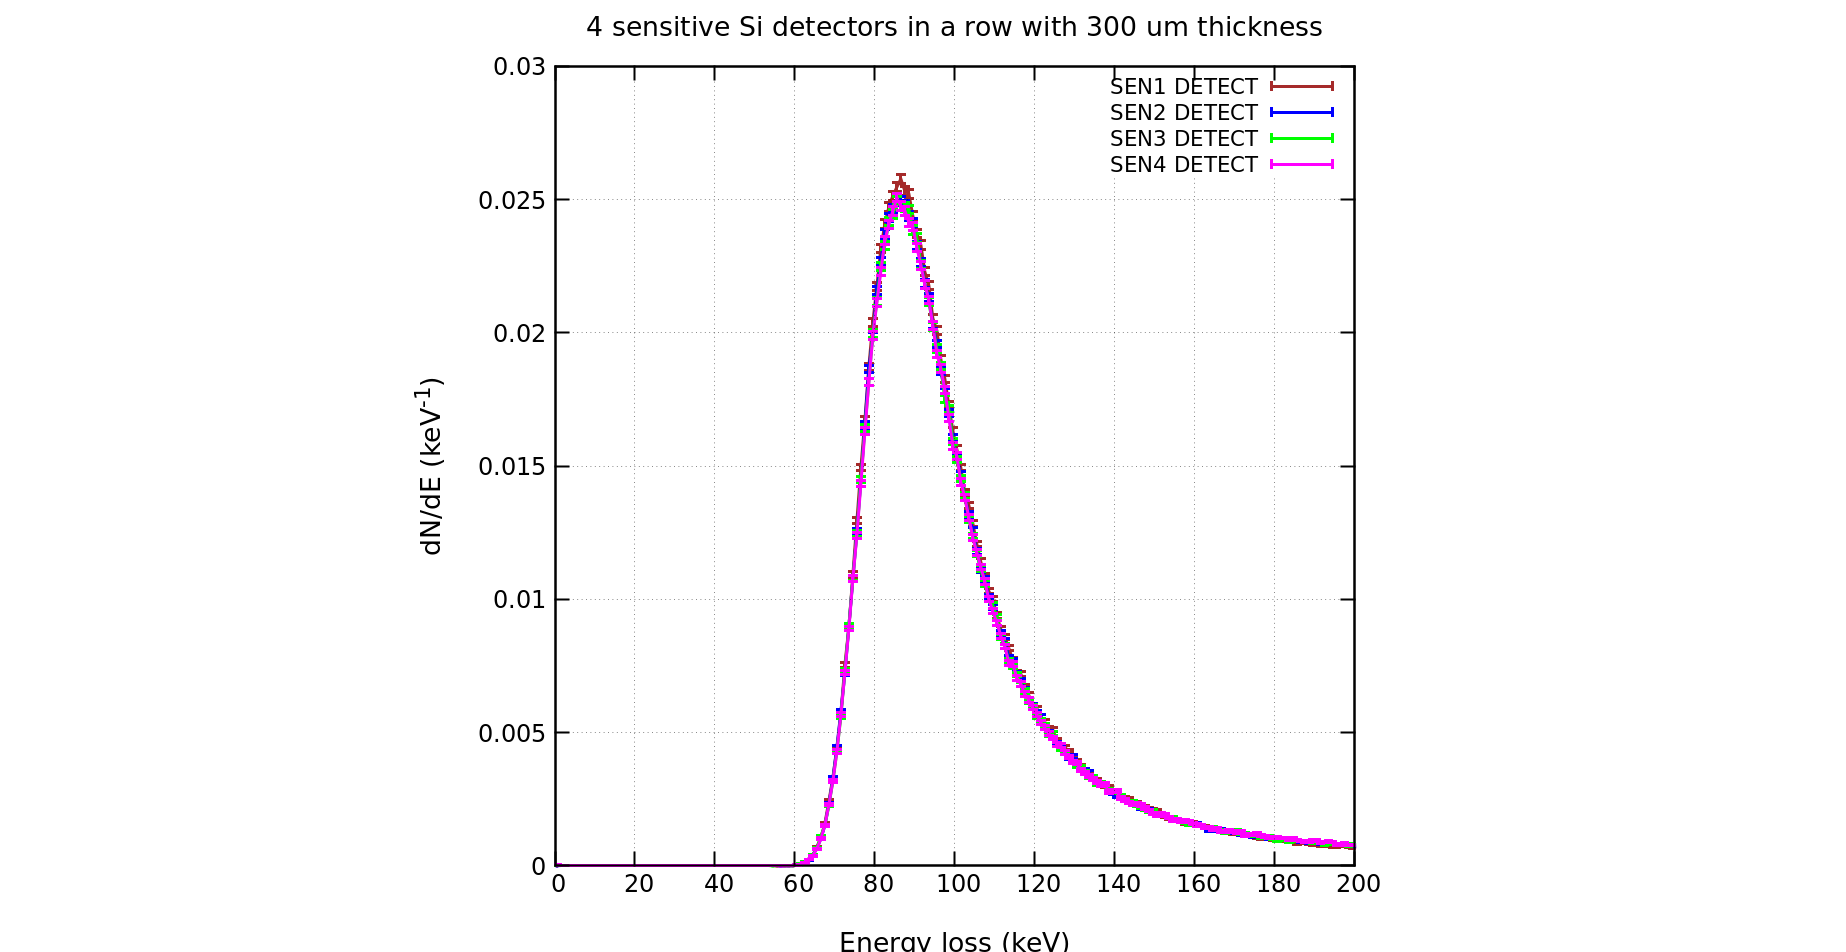
Where all the distributions following the Landau distribution and almost lay on each over.
However, if I am changing the initial particle to the Fe ions (A=56) with the energy of 1 GeV/n. I see these plots:
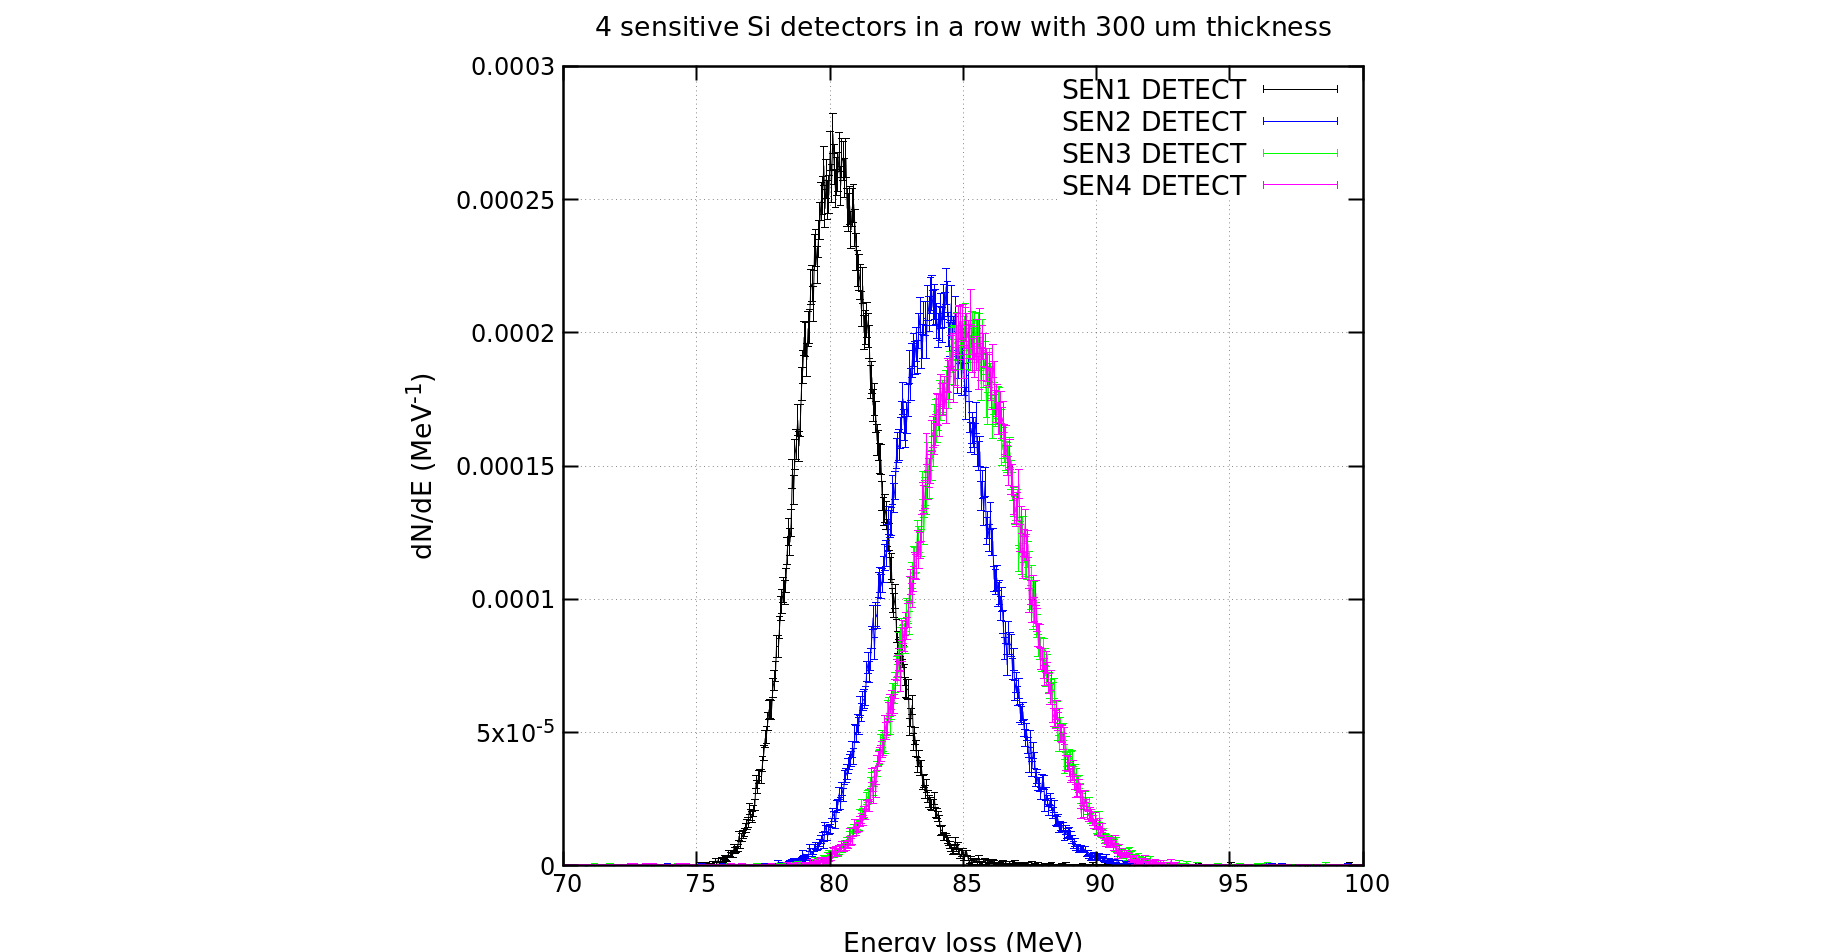
The bell shape is understandable, but why the 2nd, 3rd and the 4th distributions are shifted? Also, the 3rd and the 4th are almost lay on each over and others are not… Indeed, the expected distributions should be a bit shifted to the higher energy, but not that much, the distance between the means of the first and the second distributions is about 4 MeV. I did a simple calculations using WebAtima and I am getting average energy loss at around 88 MeV in the first silicon detector (SEN1), but FLUKA gives about 80 MeV (mean of the normal) for the SEN1 which is 8 MeV different! For the over detectors: SEN2-4 I am getting almost 88 MeV via WebAtima as well, but with FLUKA, SEN2 has about 84 MeV and SEN3/SEN4 have about 85 MeV which is still far from ATIMA results.
Also, if I am decreasing thickness of the sensitive detectors to the value of 100 um, I am getting this picture:

Which is almost the same situation to the previous one, WebATIMA says that SEN1-4 will have average loss about 29.4, but FLUKA gives 26 MeV for the SEN1, 27.4 MeV for the SEN2 and about 28 for the SEN3 and SEN4, which is closer, but still different.
Am I doing something wrong, or missing? I’ve checked the input and it is seems fine, but maybe I am wrong. I thought that distributions for the Fe ions will be normal with the means at about the same values from ATIMA, they should lay very close to each other and just a little bit shifted.
Please see the input, flair, *lis and results from the WebAtima attached below.
Best regards,
Ivan
EnLoss.flair (16.1 KB)
EnLoss.inp (4.8 KB)
webatima_result_56Fe_100um.txt (2.7 KB)
webatima_result_56Fe_300um.txt (2.7 KB)
SEN1-4_Fe_17_tab.lis (180.3 KB)
SEN1-4_Fe_100um_17_tab.lis (180.3 KB)
SEN1-4_prot_17_tab.lis (180.3 KB)
SEN1_100um_17_tab.lis (180.3 KB)