On the output I get the following message:
Error: “/usr/local/fluka/bin/fluka” executable returned RC=2
… fluka run: 0.730433 s>e> ERROR: Return Code=2
In the log file, I get a bit more details about the error:
At line 225 of file comlat/flkcgi.f
Fortran runtime error: Bad integer for item 1 in list input
Please could someone advise where the error stems from?
Hallo Cedric,
as you noticed, the error details should be looked at in the .log/.err files, since the system message (Return Code) does not mean much. In your case, the problem appears to be related to your input reading (as it may happen if the input file contains an error). However, I could run without any problem the input file you attached. Which FLUKA package are you using and with which gfortran version?
Actually the two error files indicate that both cycles were completed successfully, after 10,000 primaries each, and do not look compatible with the former abort. Are you sure that the latter is not caused by a different corrupted version of the input file?
The input I used is the one I uploaded earlier. I have rerun the simulation and got the same error messages.
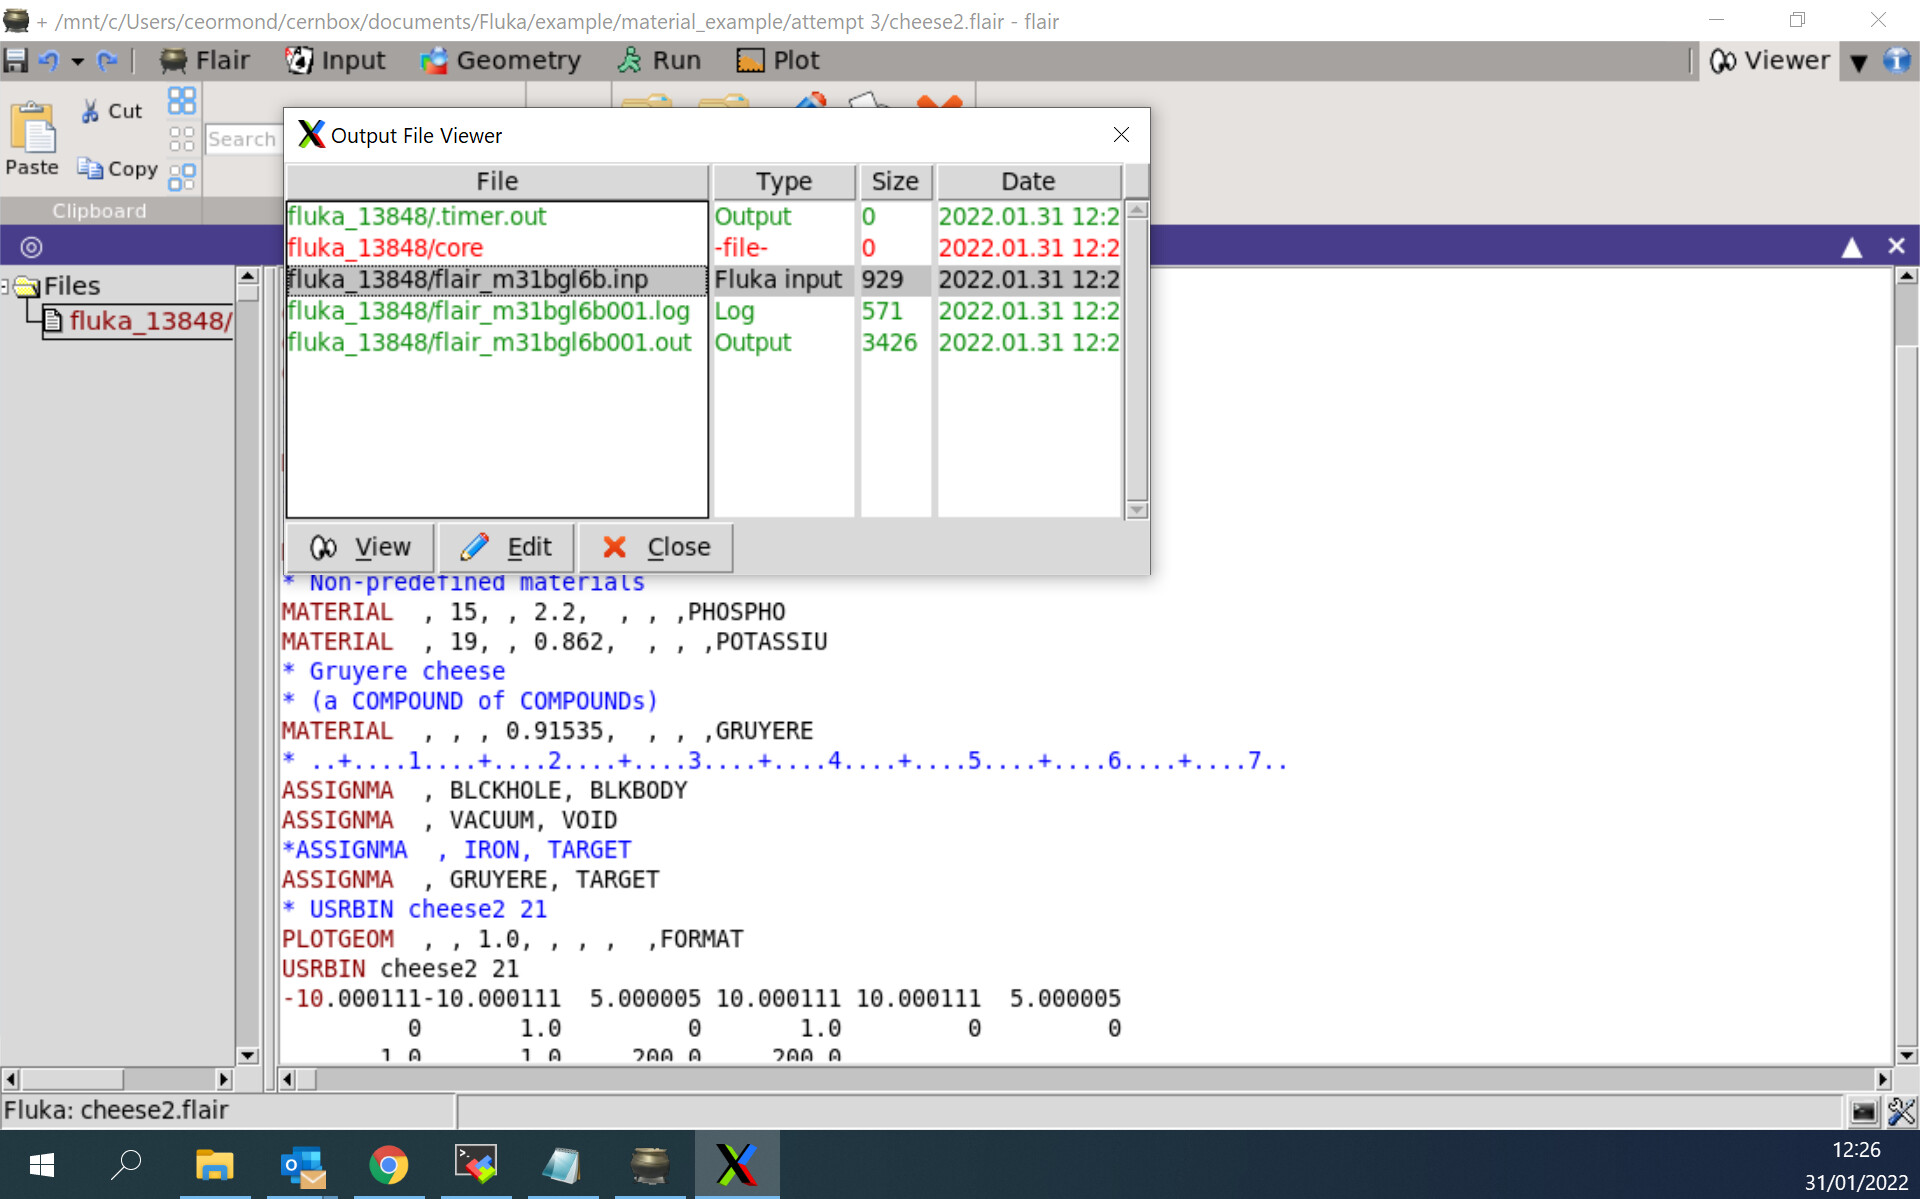
I have saved the input I just ran and uploaded it again below. cheese.inp (2.3 KB)
Does this input generate the .err files as above? If so, this means that the runs went just fine (they do not contain any error message, just the random sequence up to the end). The question is then how you get (at the same time?) the error:
At line 225 of file comlat/flkcgi.f
Fortran runtime error: Bad integer for item 1 in list input
that is not compatible with the generation of regular .err files.
Yes, this did generate the same .err files, with no errors inside them.
However, it is interesting to note, that the runs did not generate any errors, nor did the processing of the runs. It is when we click on the “plot” icon for the .bnn file that we get the error messages.
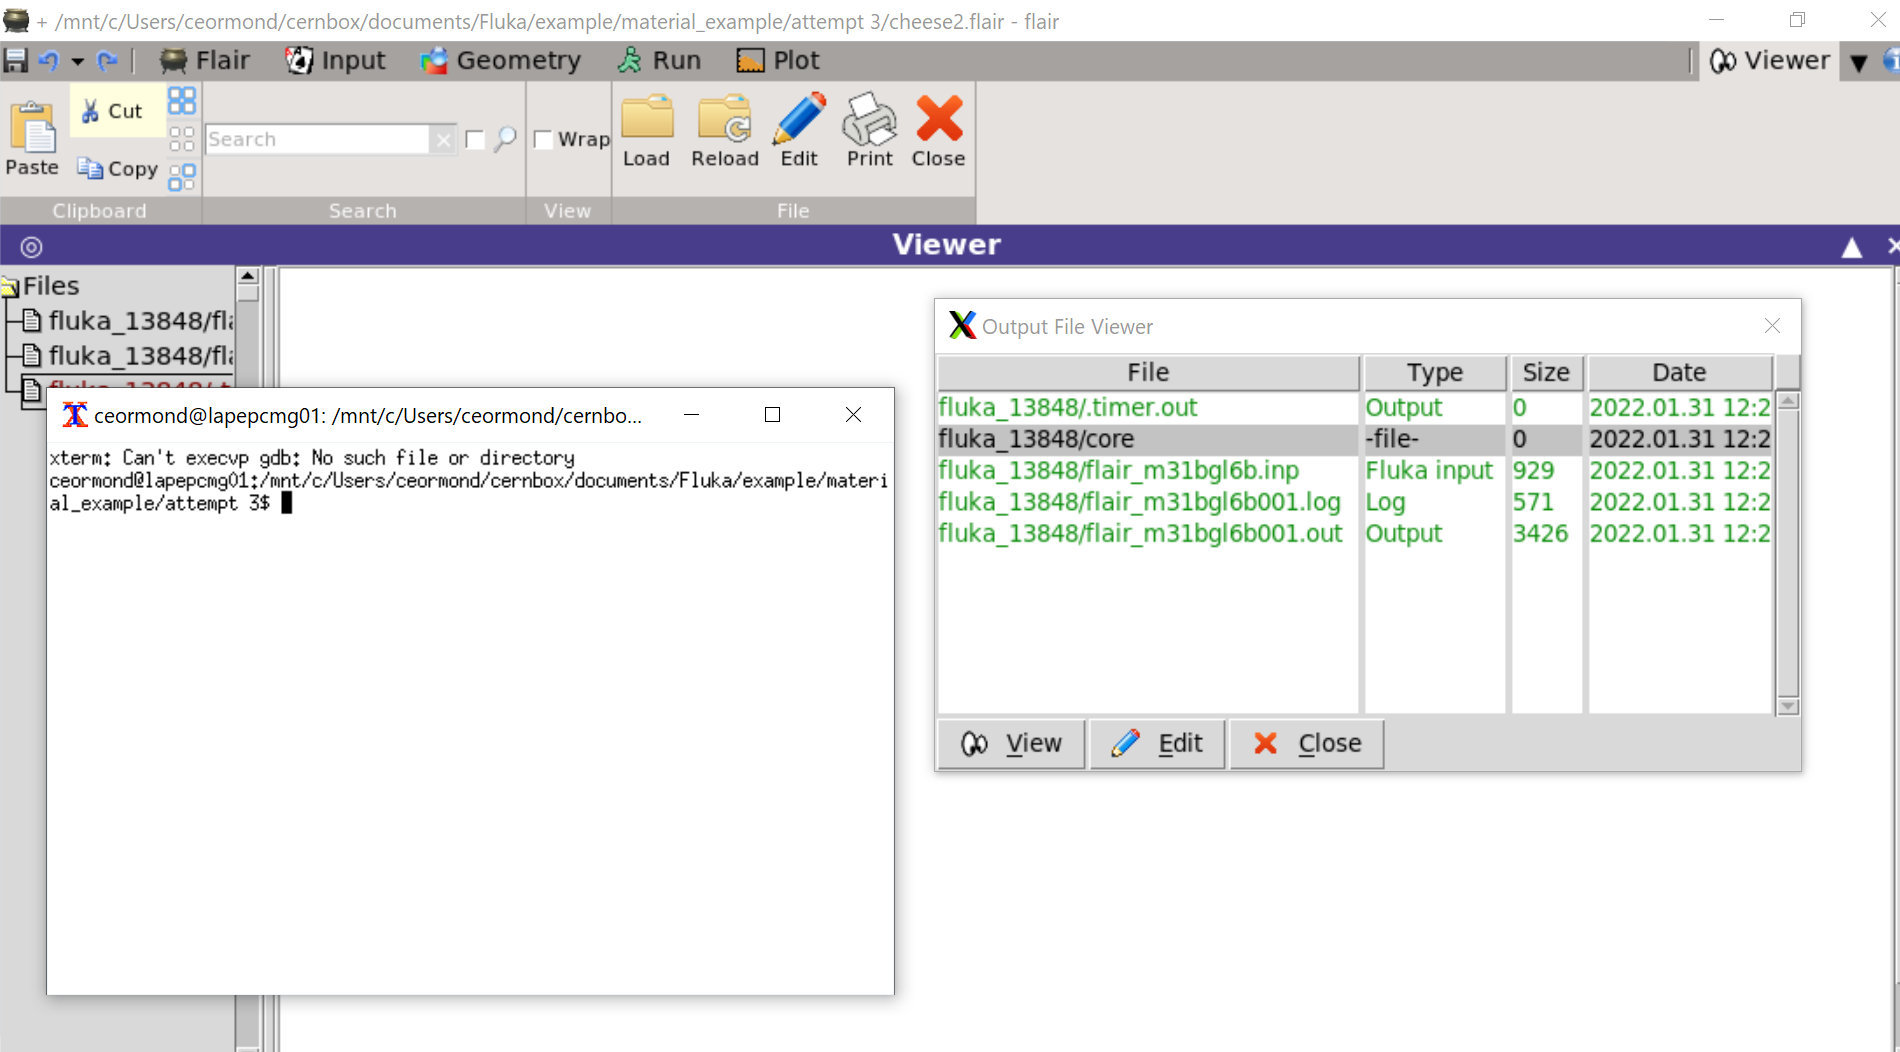
I don’t know why I get these two error messages at the same time. I also found the following popup. Could this help decipher the problem?
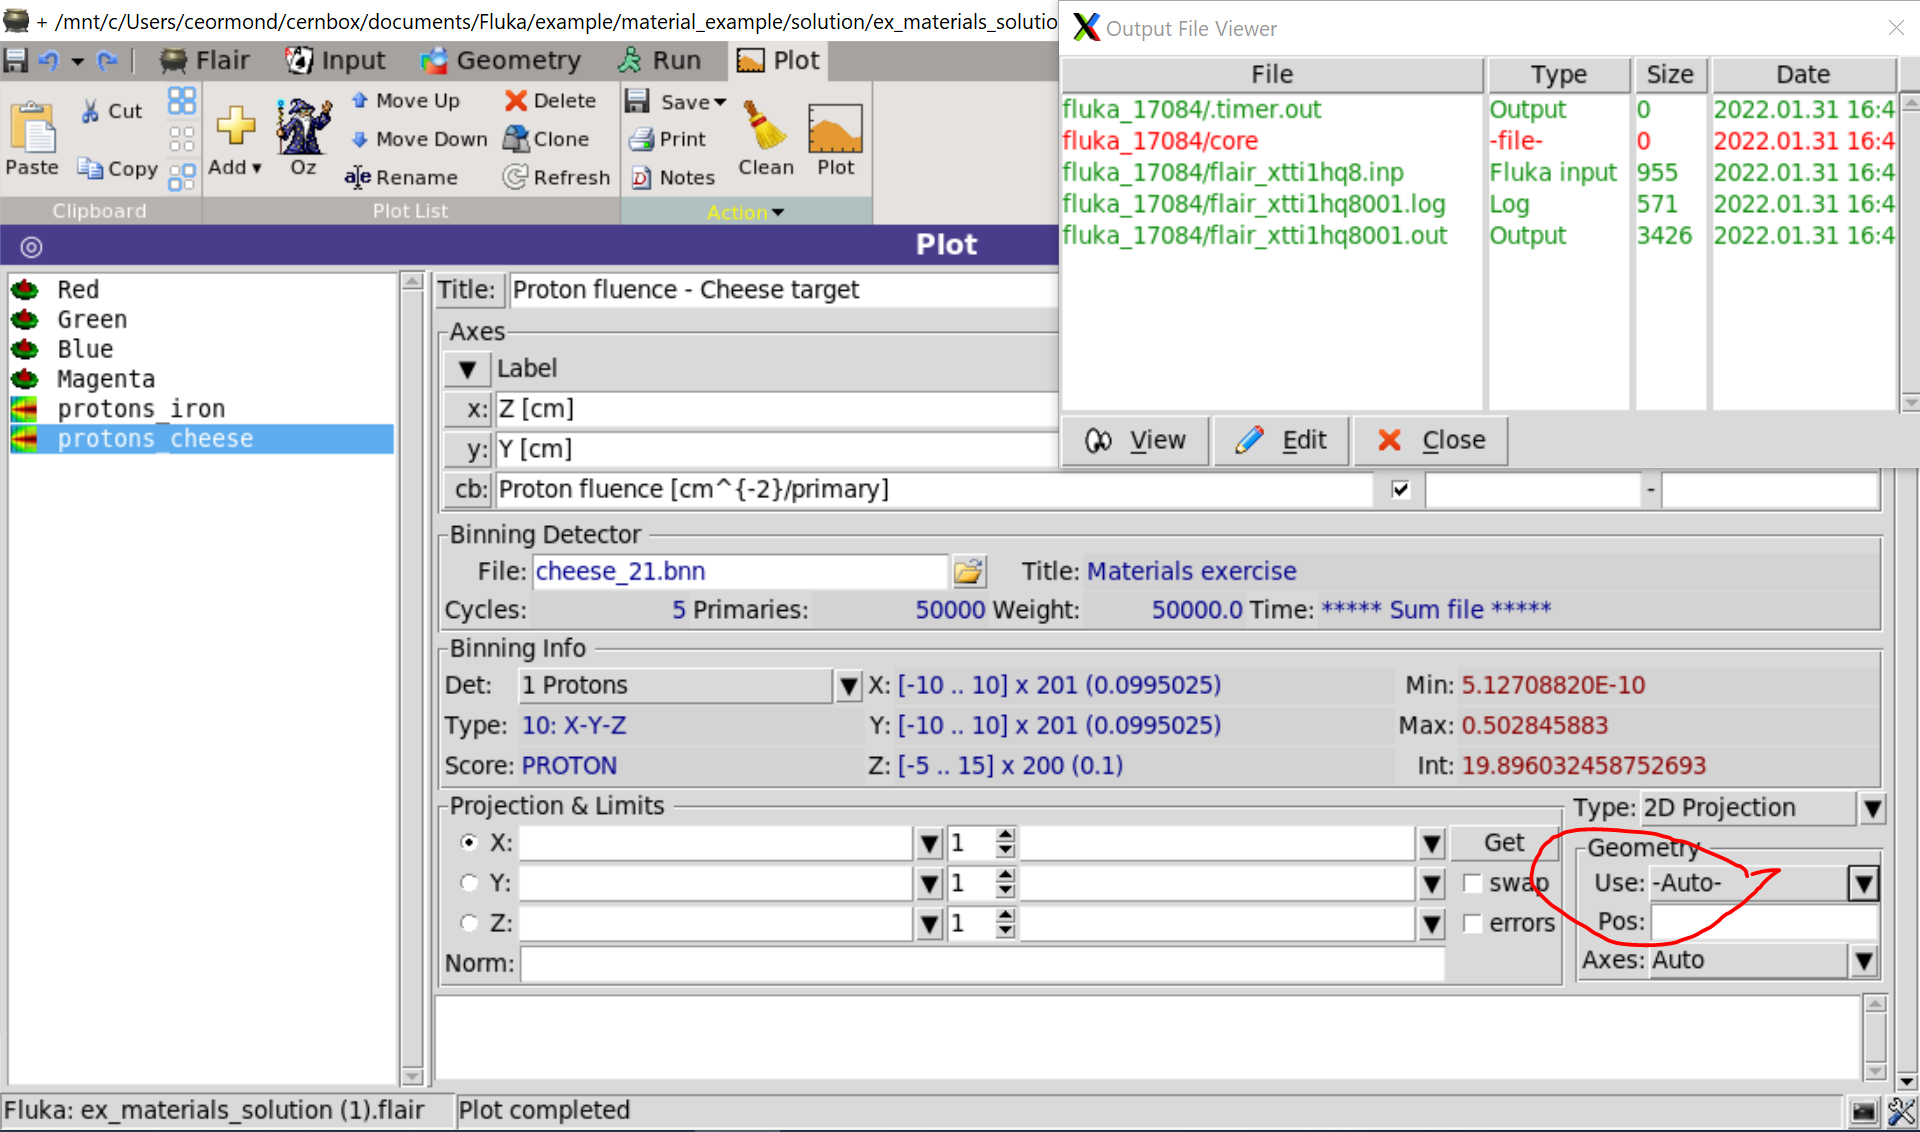
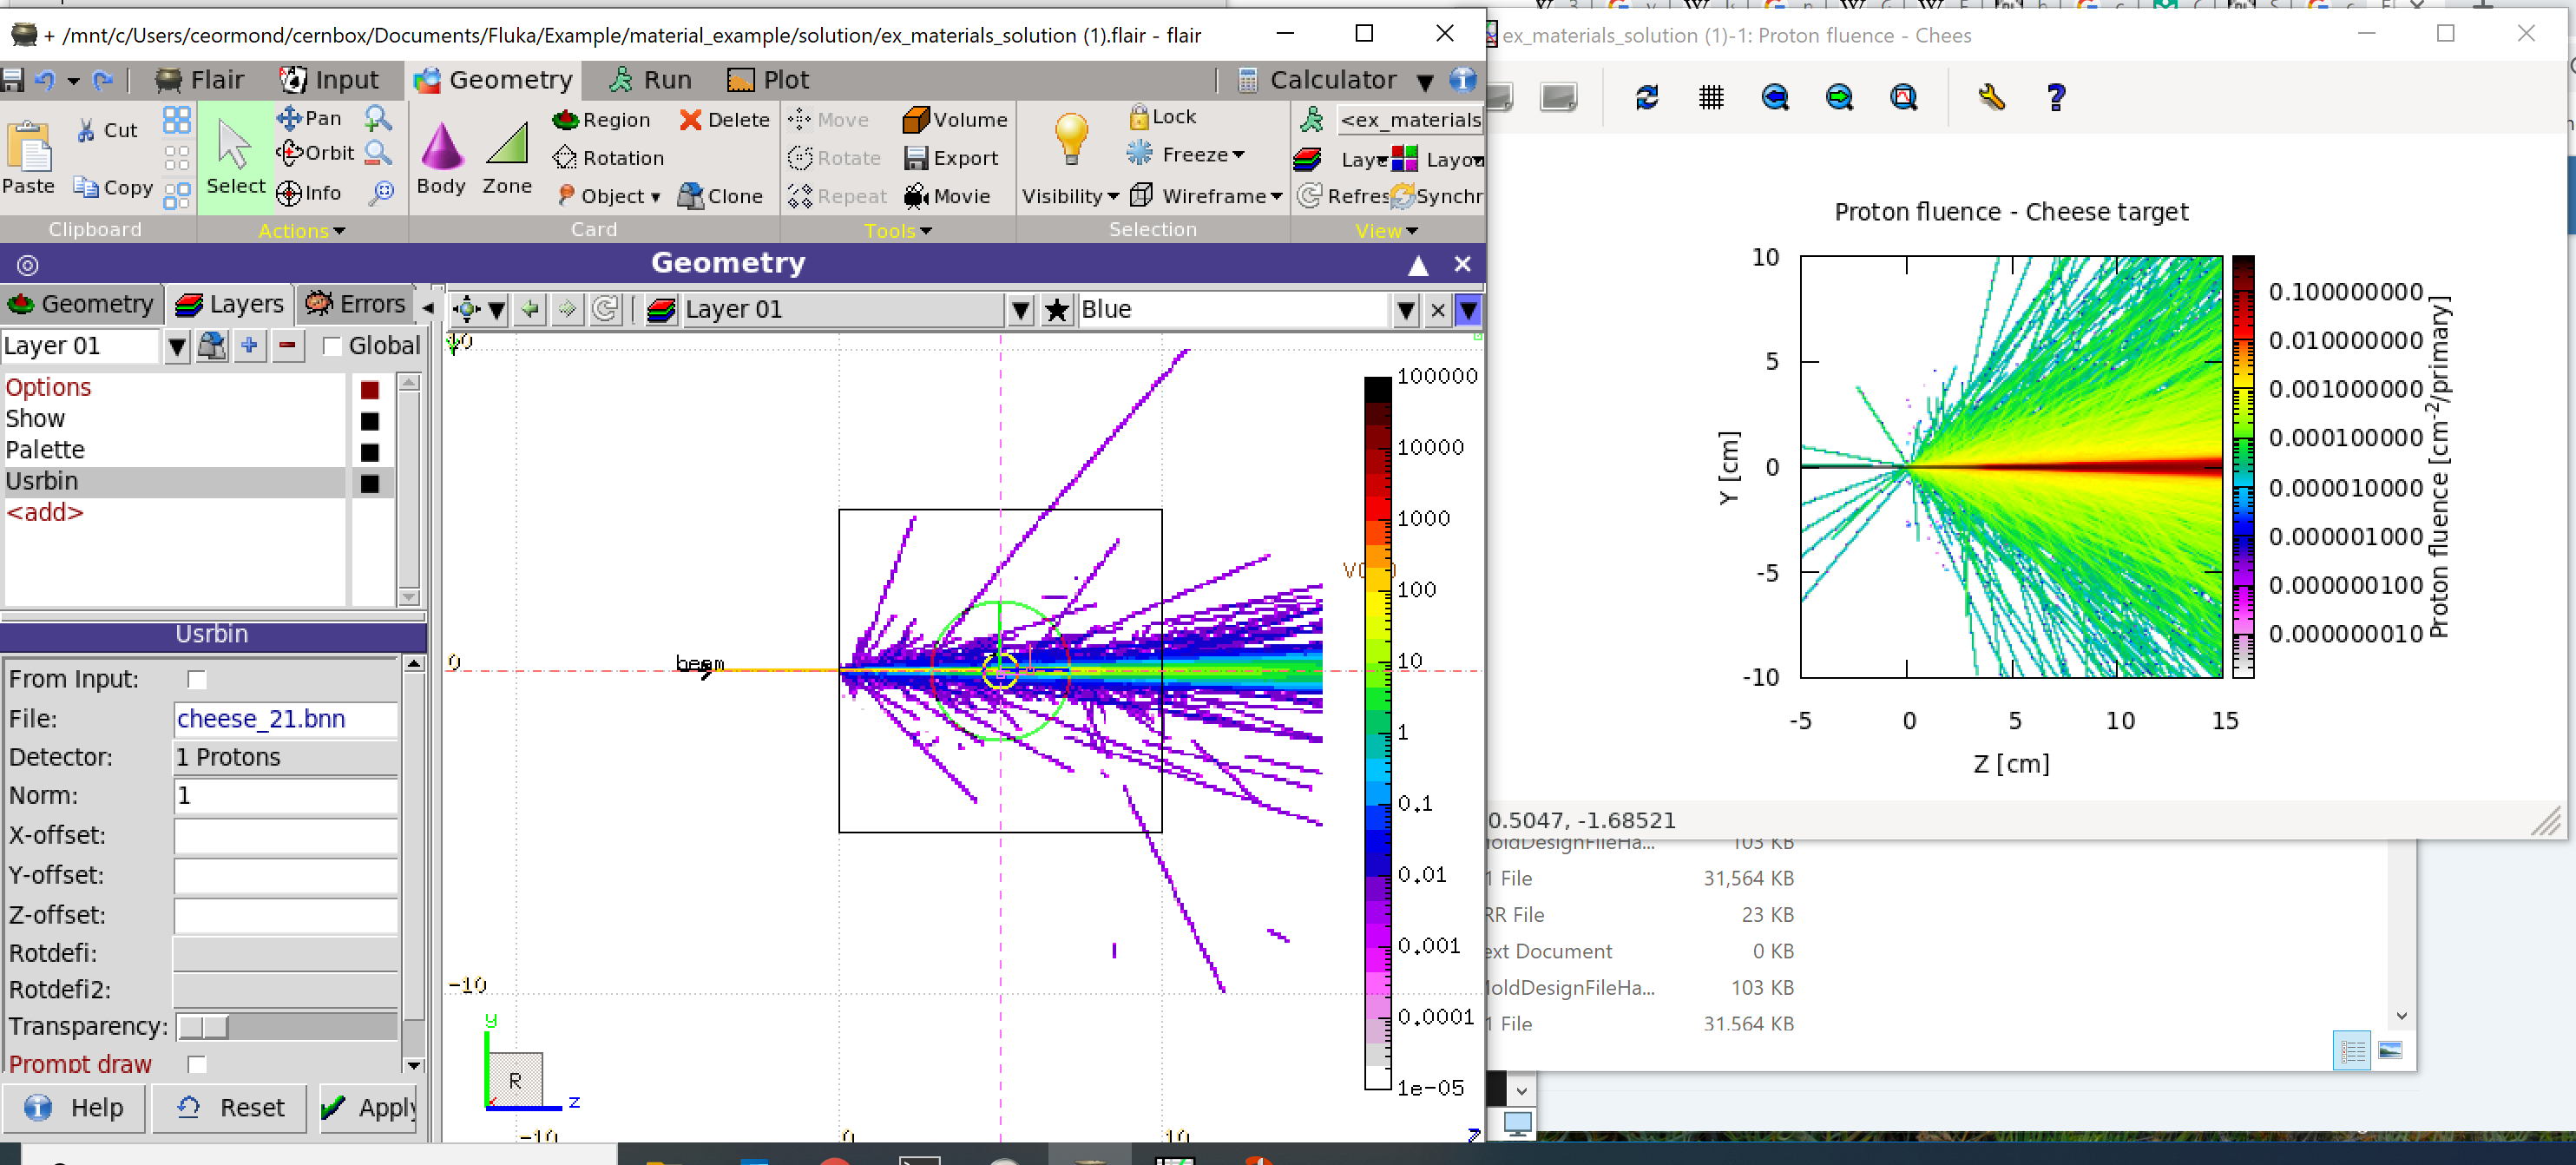
after many comparison, I noticed the error arises from the plotting. If I leave the geometry use as “auto”, (circled in red below), I get the errors discussed above.
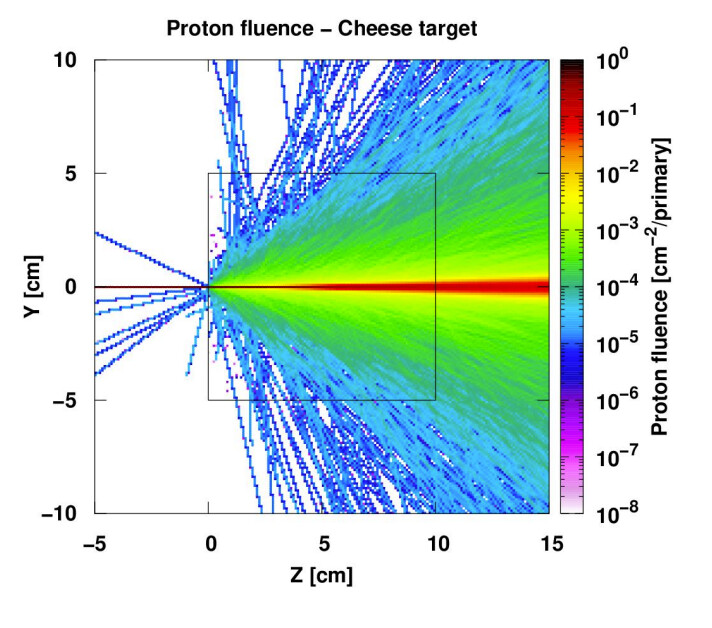
Dear Cedric, the easiest way to obtain the plot you want, you can go to the Geometry editor (with your input file loaded in Flair). In the Layers tab, you can create a new layer by selecting “” and subsequently select “Usrbin”. The window pane that pops up will allow you to select any USRBIN output file obtained from your FLUKA runs and any USRBIN detector you defined in the input file which you want to plot. After hitting “Apply”, the new layer (by default named “Layer 0X”) will be available to plot in any of the four Geometry editor view windows on top of your geometry.
The other option is indeed to use the method for which you encountered some errors above. However, first plot in the specific view corresponding to your USRBIN location and dimension in the Geometry editor and then instead of selecting ‘Auto’ you can choose either the ‘Red’, ‘Blue’, … views and superimpose on your plot. Do either of these options help you to obtain what you want?
However, I don’t get visually the same result. I guess this is caused by the scale of the proton fluence on my geometry viewer. Do you know how I can adjust this scale?
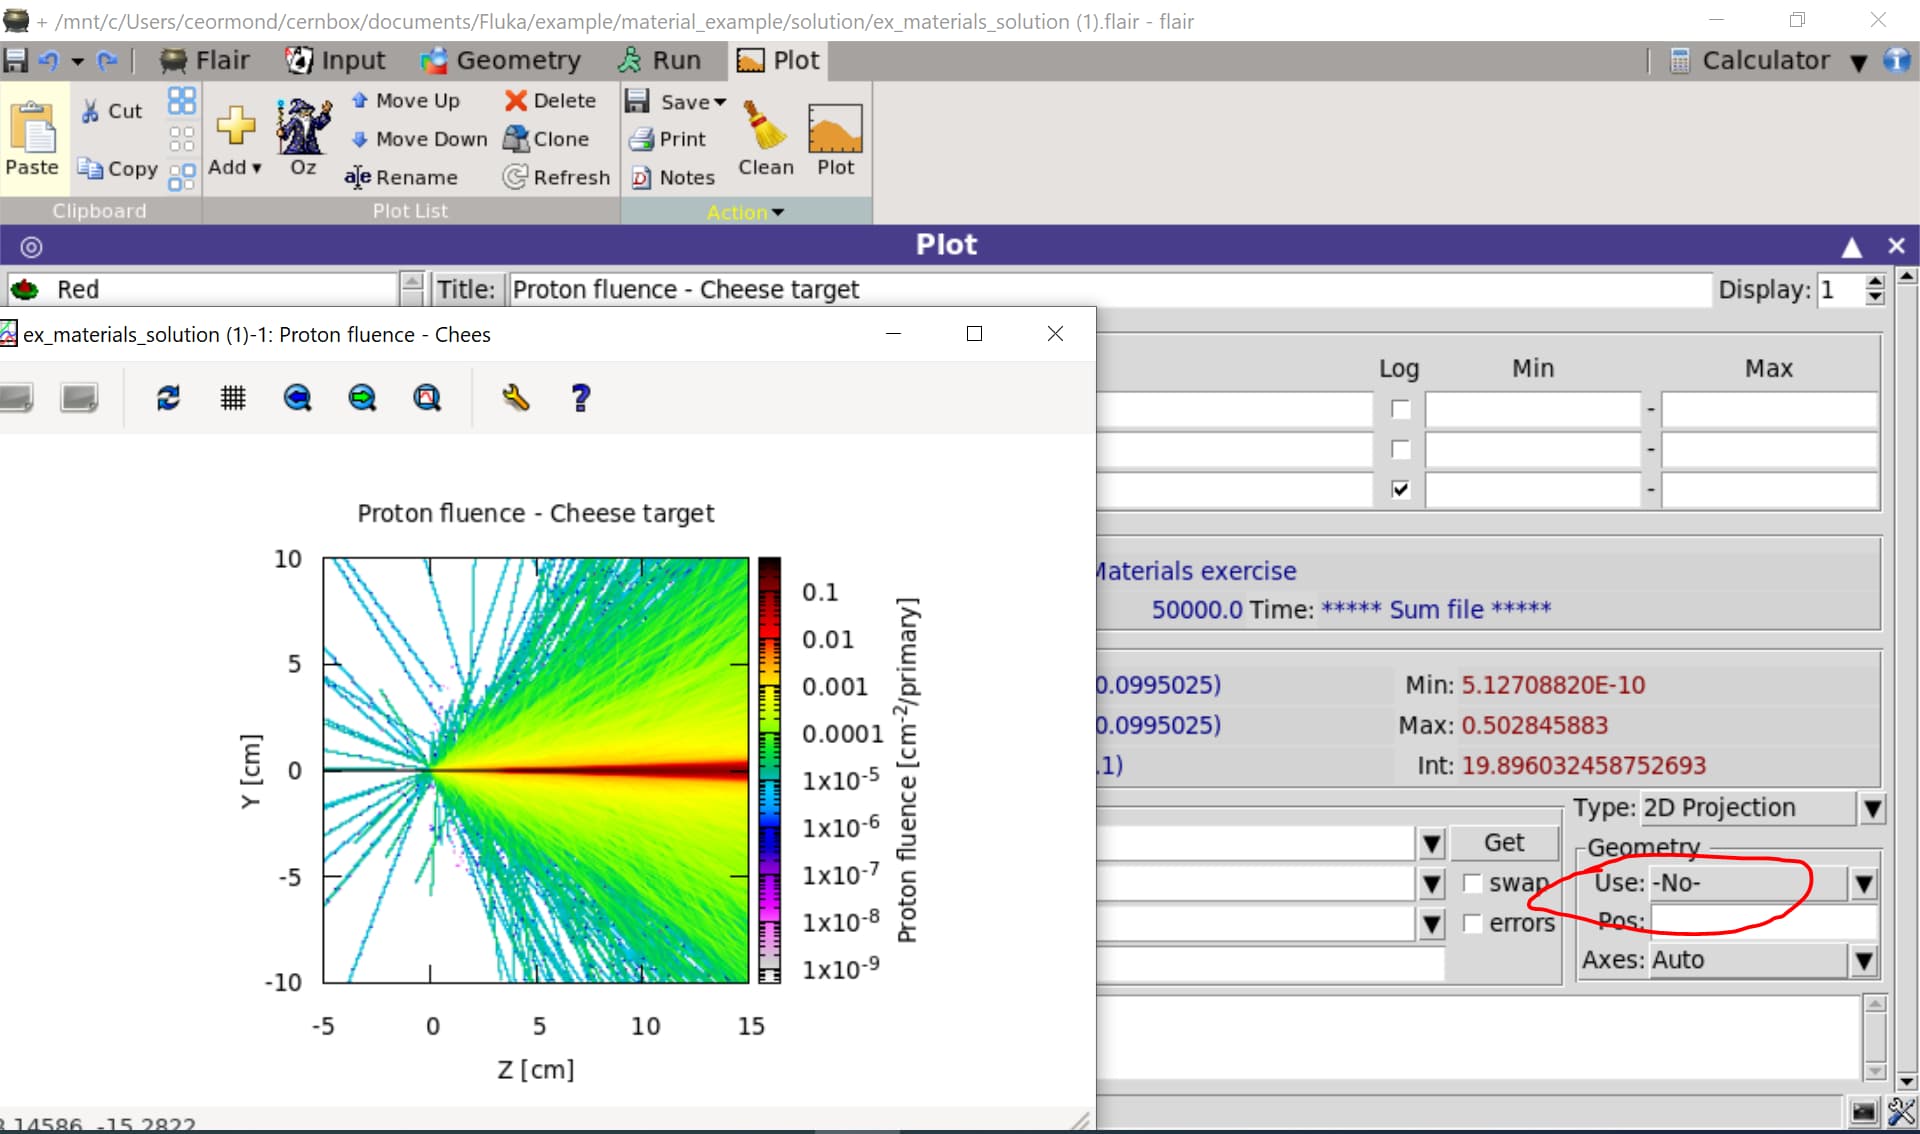
Unfortunetaly, when I click on plot, in the plot tab, for any “Geometry use” other than “-auto”, I only get the proton fluence, without the cheese target border superimposed on the figure.
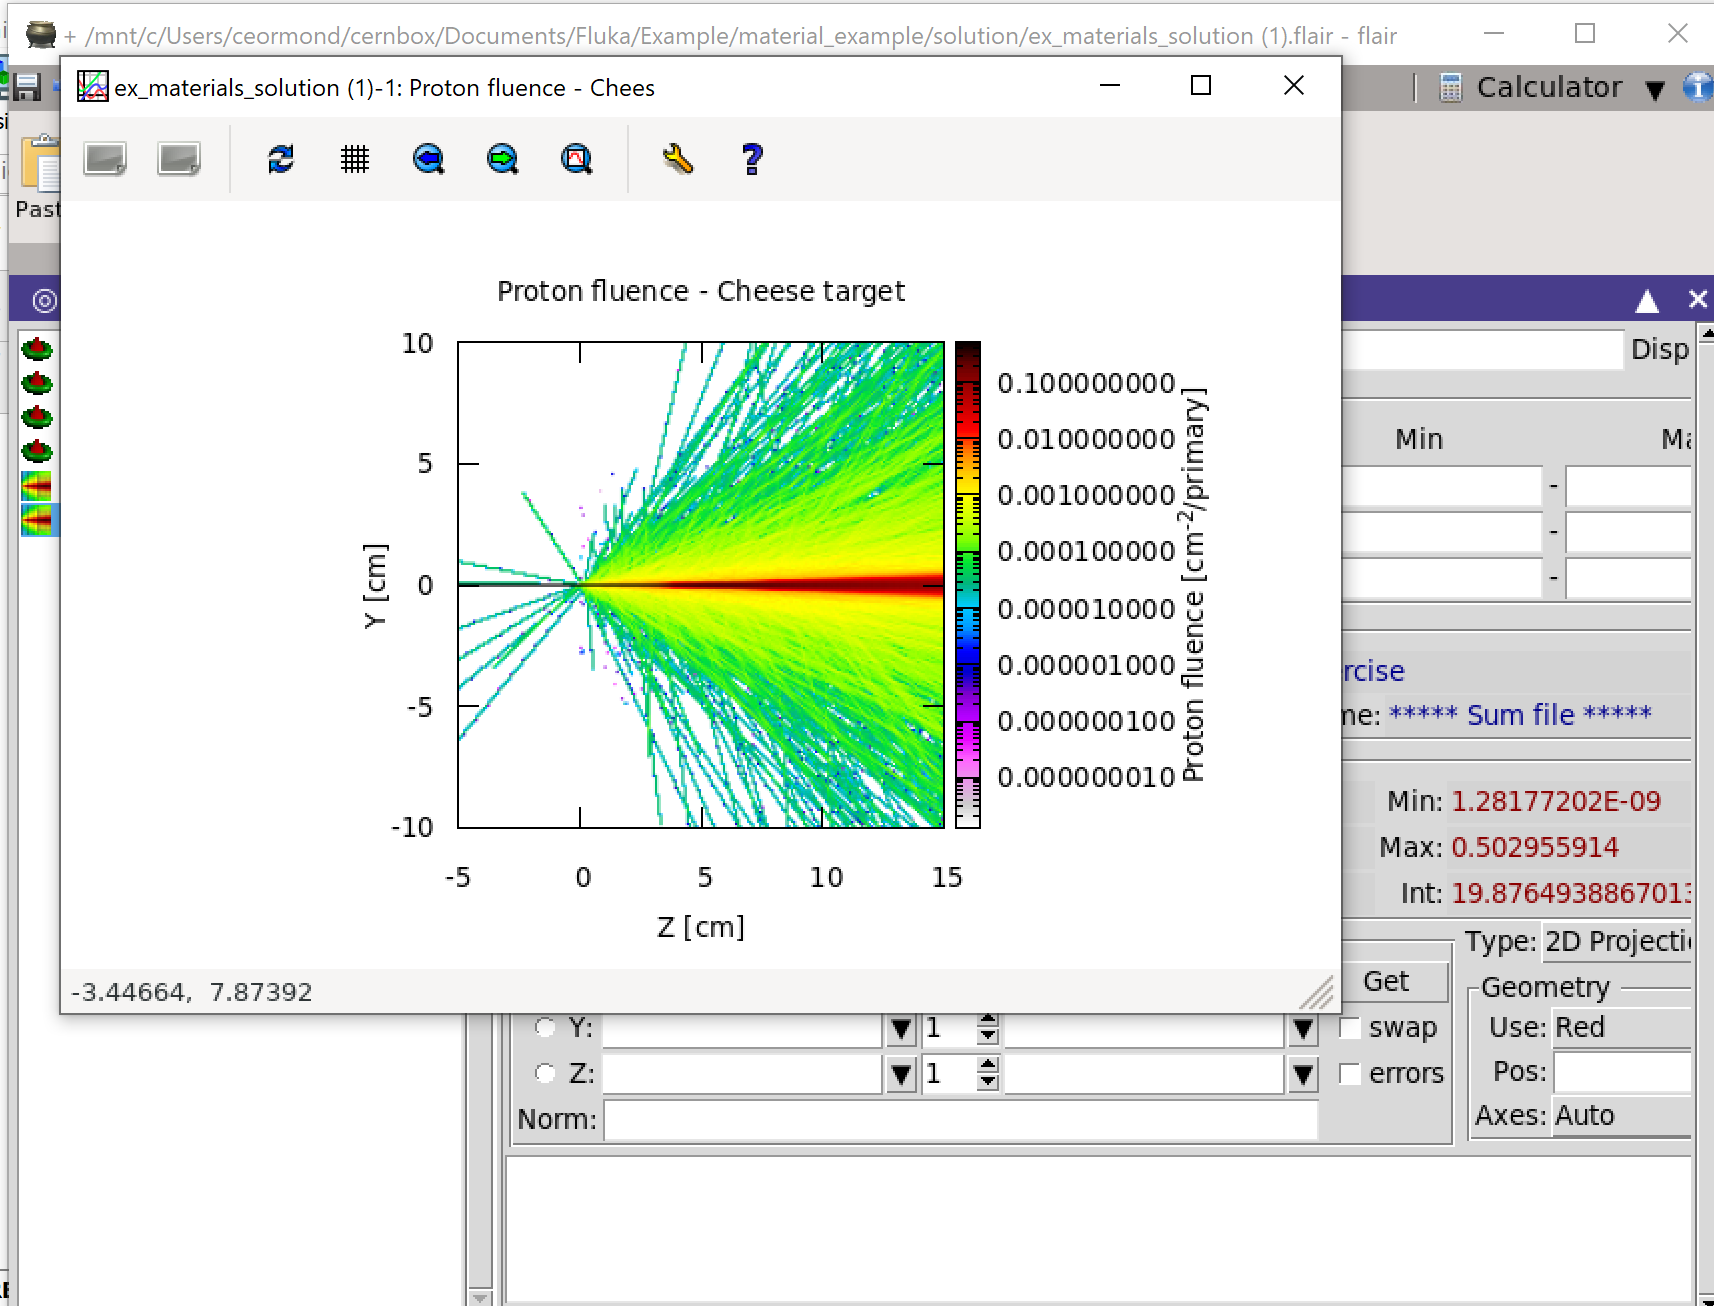
As can be seen from your plots indeed the scale of the plotted results is different (comparing the color bars). Guiding you using your top left plot: Go to the “Palette” pane, there you can adjust using “Minimum” and “Maximum” to match what you have in the Plot tab. Another note here is to make sure that also the normalisation of the results is the same: you choose now to show your results per primary but if you want to multiply the results with an appropriate number (e.g. the proton beam intensity or fluence) you need to make sure this also matches up. Also in the top left plot in the Ursbin pane you can do this by changing the value in the field “Norm:”.
In the Plot tab then, you need to first plot a certain window from the Geometry editor (i.e. “Red”, “Blue”, …etc.). Make sure to plot first in a region corresponding exactly to the USRBIN you want to plot. I.e. what do you get when you plot the “Red” window for example? Do you see then the geometry superimposed on the USRBIN plot by selecting “Red” for the geometry use?