Dear All
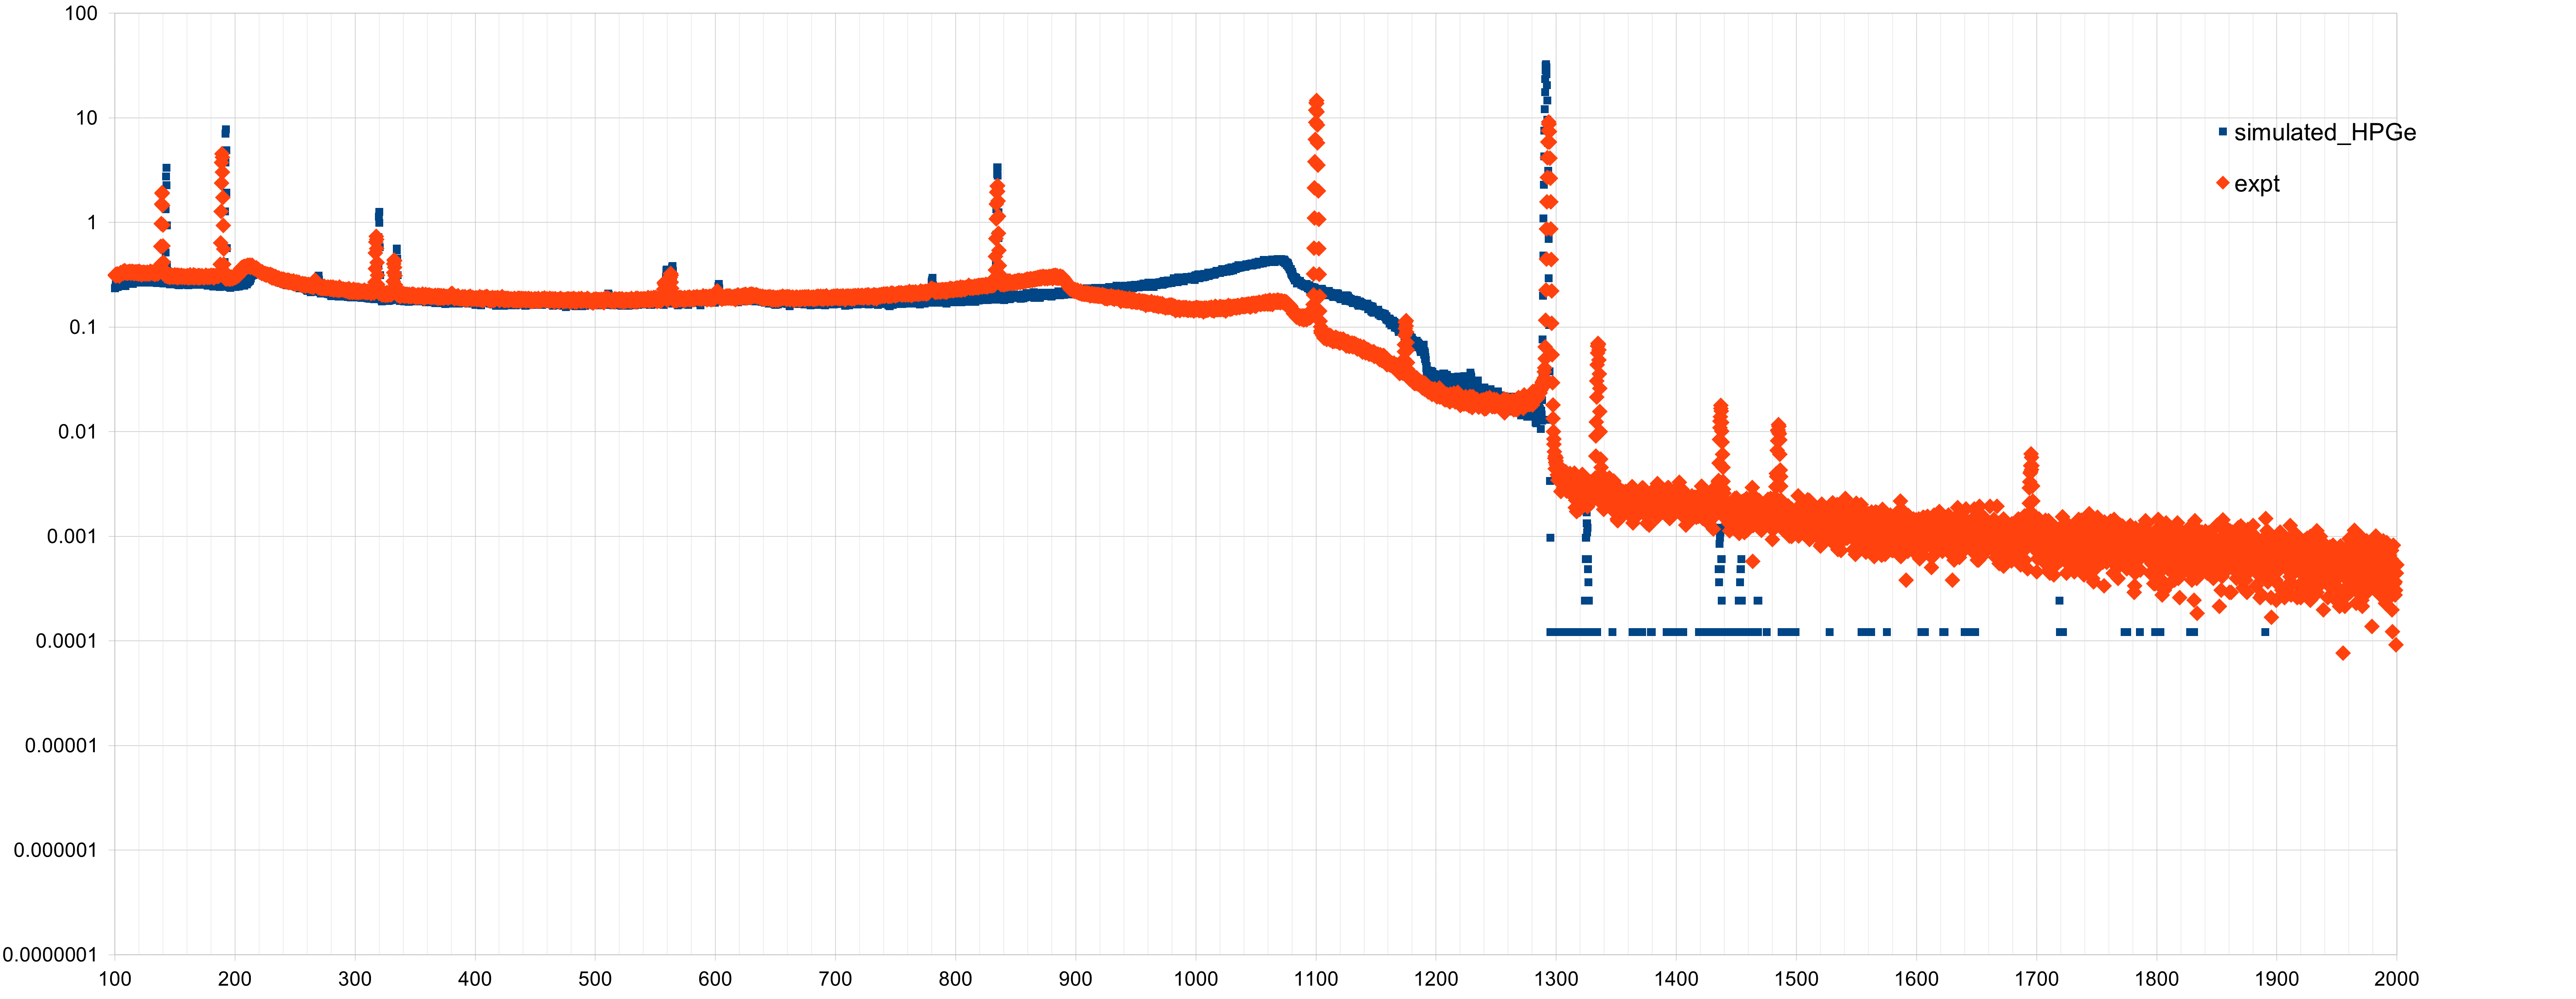
Greetings! I am having a small problem while using DETECT card to score energy deposition in HPGe detector. The peaks in the output of detect card show a flat top as shown in this picture
There may well be nothing wrong with your simulation (I did not check). But looking at the *tab.lis file, you can see that you have a bin width of 3-4 keV, e.g. from 1097-1100 keV, exactly where you see the flat top in the first peak. This has to do with the number of digits printed by detsuw (the relevant processing utility invoked by Flair), which is limited for an HPGe spectrum where the binning is well below 1 keV.
You can modify detsuw.f under /pathtofluka/src/tools, specifically the format line labelled 9501 almost at the end of the file: 9501 FORMAT (4(1P,1X,E10.4))
Add a digit (or two) e.g. by changing to E11.5, save, then, in the tools directory where you are: make clean make
to recompile the utilities.
Reprocess the simulation results (Clean/Process) and you should see a more reasonable plot.
Dear Andrea
thank you for your quick reply. your suggestion worked. changing detsuw.f didn’t help as much as changing the bin width in tab.lis file. I changed the bin width in tab.lis file to ~ 0.3 keV, that seem to work. except now, the peak 1100 keV is gone!
I suspect you are mixing output files and plots. E.g. the latest *tab.lis file is clearly not the one used in the last plot. In fact it displays all the problems we previously discussed with many bins having identical lower and upper bin limits and several lines sharing the exact same value, especially above 1 MeV. As I explained, you cannot describe sub-keV binning above 1 MeV printing only 3 decimal figures.
By the way, I notice now that the output file you shared is not the DETECT output, but no scoring is saved to unit 25 in the flair file you shared. So of course changing detsuw.f made no difference.
Could you please send a consistent set of files?:
an input file with your desired (DETECT) binning (e.g. ~0.3 keV/channel)
the *tab_lis file corresponding to exactly this input
Dear Andrea
thank you for the reply. I didnt make things clear in the beginning. This simulation is in two steps. In the first step, I irradiate a sample with neutron beam and let it cool down for few days. Then I record the gamma rays coming out of it using a USRBDX card. The fluka files for the first steps are- DSQ_activation_analysis.inp (7.3 KB) DSQ_activation_analysis.flair (10.0 KB) source_newgen_NAA.f (20.8 KB) full_neutron_spectrum.dat (3.1 KB)
So, i think i should try to increase the number of digits in the output of USRBDX card in the first step. can you please help me with that?
thanks & regard
saurabh
Dear andrea,
To achieve sub kev binning in the *tab.lis file, I tried to change usxsuw.f. It has a line similar to what you mentioned- `9501 FORMAT (4(1P,1X,E10.4))'. I changed E10.4 to E11.5, like you suggested for DETECT card. This change seems to help. now the tab.lis files has numbers upto desired decimal points. THe spectrum looks better too.