I’m running a simulation in which I want to score the fluence of gamma rays in a given region. I’m using both USRTRACK and USRBDX and in the same conditions I would expect the same result, but that’s not the case.
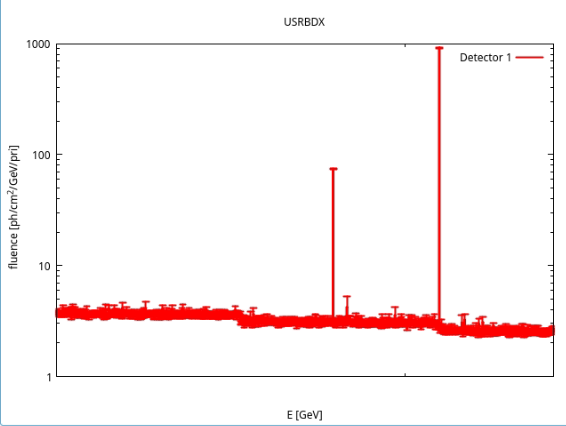
In the two cases I get the following plot, with energies ranging from 400keV to 550keV:
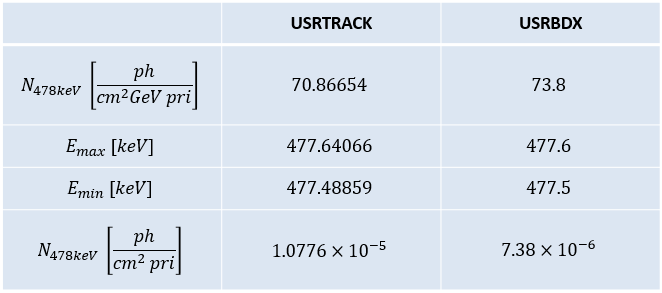
I’m focusing on the 478keV line (it’s the second in order of height, the highest is at 511keV). Since both cards’ scores are in photons/cm^2/GeV/pri (I specified the volume in the USRTRACK card and the surface in the USRBDX card, and I didn’t specify the solid angle), I multiply by the energy bin width (since they are not the same for USRTRACK and USRBDX). I expect the last numbers in the table to be the same for both cards, but they are not.
Am I missing something? I attached the input file for clarity.
Please be aware that the two scoring measure fundamentally different quantities: with USRBDX (in this configuration!) you can measure the average fluence on the surface of the detector, while with USRTRACK you obtain the track length density distribution normalized to the detector volume. One might find helpful to imagine USRBDX as USRTRACK for a region of infinitesimal thickness.
So, I would say that some minimal differences in the measured fluence are not a surprise (in the first line of your table).
The way the post-processing routines (usxsuw.f and ustsuw.f) work is slightly different, despite the core idea being the same. Particularly, they print in the (*.tab file) the same quantities: the lower energy bin, the higher one, the fluence density, and the statistical uncertainty. The difference arises in the FORMAT they use:
USRTRACK (ustsuw.f): FORMAT (4(1P,1X,G14.7)). This means that seven digits are used after the decimal point.
USRBDX (usxsuw.f): FORMAT (4(1P,1X,E10.3)). In this case, the digits used after the decimal point are only three! We are committing an error of the order of 0.05% just by truncation.
This explains why you see different energy bins in the .tab file. In reality, they are the same. With 1000 energy bins you are asking for a resolution of ~100 eV, while the energy under consideration is of the order of 400 keV. The truncation error is relevant and is the source of the discrepancy in the last line of your table.
For getting better output in your simulation, you have two possibilities:
Reduce the number of energy bins.
Compute the bin width (avoiding the truncation error) and process the simulation results externally.
P.s. please notice that the DETECT scoring is not working in the configuration you use now, but I won’t further go in detail since it is not the topic of your question.