Following the recommendations of the experts in this forum post (FLUKA and experimental results for CsI detector - #6 by ceruttif), I have made some changes to my approach in order to make the units of the y-axis consistent between the FLUKA simulations and the experimental results.
To convert the given counts to (counts/(s keV)) with a measurement time of 100 seconds, I divided each count by the energy width of the corresponding bin and by the measurement time, using the formula counts/(s keV) = counts / (energy interval * measurement time). I also applied this method to the FLUKA simulations, as recommended by Francesco Cerutti.
However, despite these changes, my simulated results still appear to be significantly lower than the experimental results.
I also encountered some difficulties when using the DETGEB card instead of the Gaussian broadening routine suggested by David. I have encountered an issue while using the DETGEB card in FLUKA. It seems that the Gaussian broadening is not being applied, and despite my efforts, I have not been able to identify the mistake that I may be making. Also, When attempting to simulate the spectrum of 241Am and 133Ba using the DETGEB card and a user routine, the resulting spectrum did not form the desired peaks and was incorrect. On the other hand, when I ran FLUKA without the user routine, the peaks were formed but without Gaussian broadening.
I would appreciate any further advice or guidance on how to address these issues.
I can’t comment further on your normalization, @ceruttif’s explains in detail how to do the comparison correctly. The only thing I can think of is that you have the activity/measurement time wrong, or the arbitrary unit of the measurement already contains some normalization.
The DETGEB card in your input doesn’t contain any parameters for the broadening, so the applied FWHM is zero.
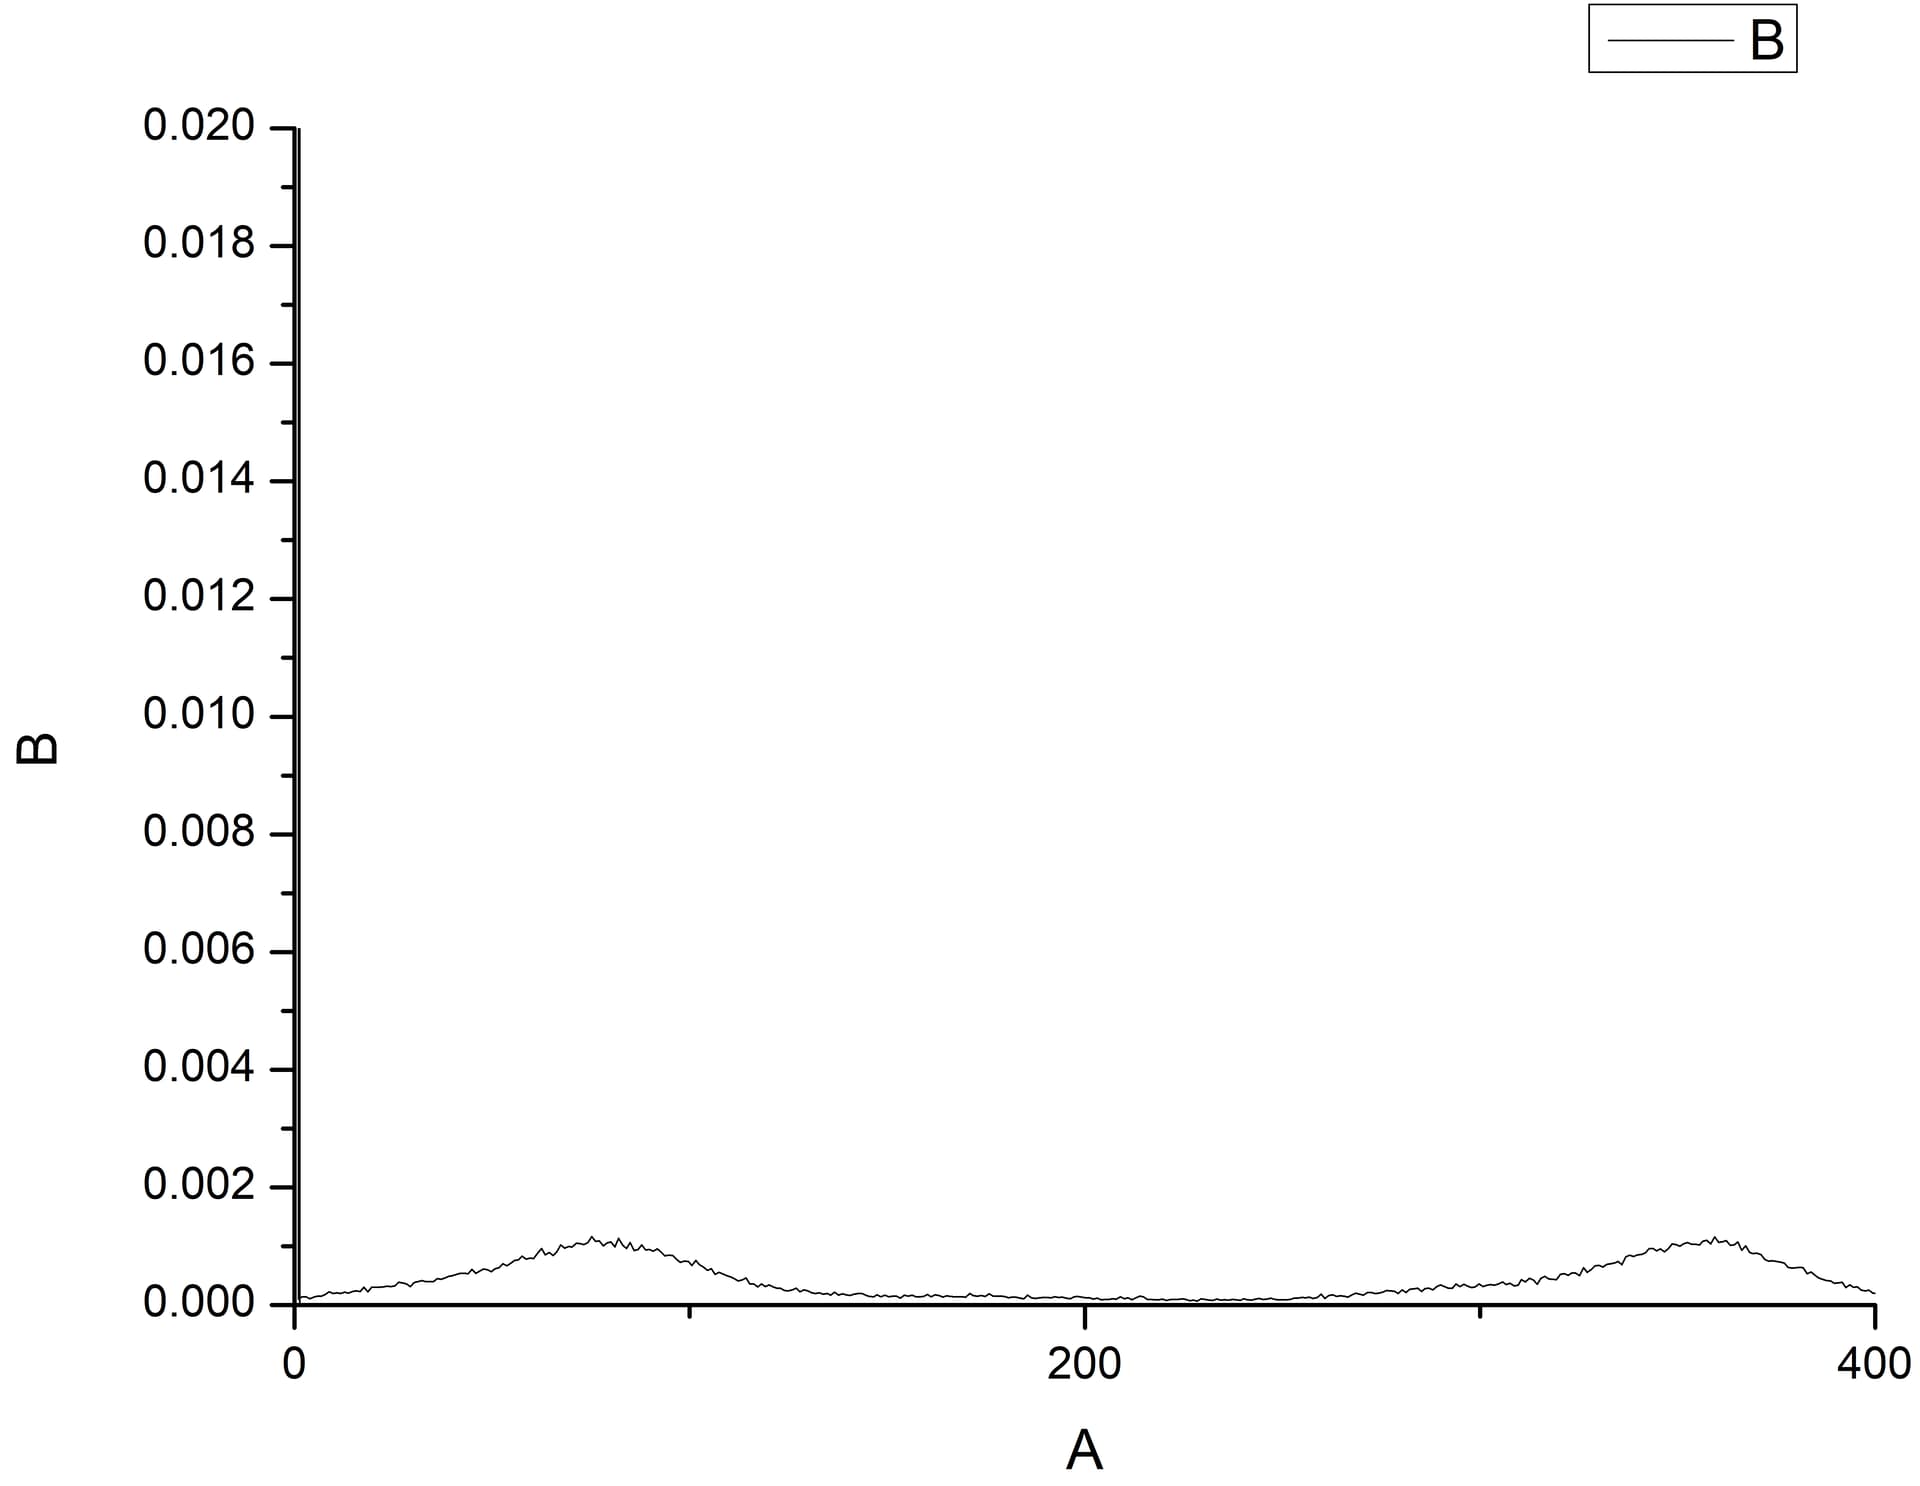
It is not clear to me, what problems you have with 241Am and 133Ba. You can always verify the spectrum of the source by adding a USRBDX scoring for the first surface between the source and the detector.
Dear David,
Firstly, I would like to thank you for your prompt response.
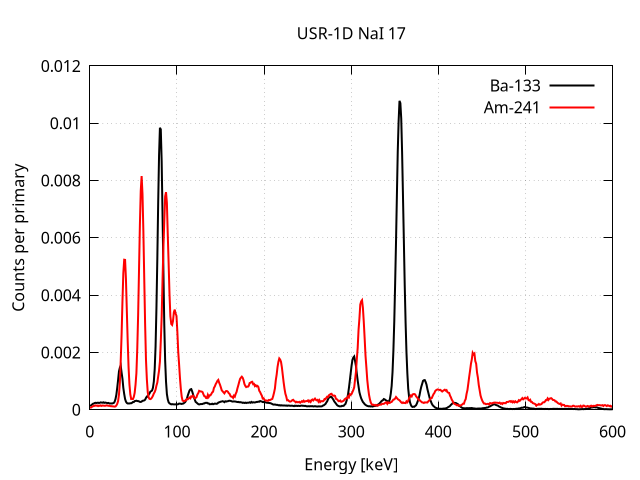
I have attached an example where it can be observed that the spectrum for 133Ba is not proper. Only two peaks are visible, but they are also significantly broadened. This issue occurred when I utilized the user routine.
Similarly, the same problem occurred for 241Am. However, when I did not use the user routine, a sharp peak was obtained without any Gaussian broadening
I am writing to express my concern regarding this issue and kindly request your assistance in resolving it. I would appreciate any guidance or suggestions you can provide.