Dear users,
In mgdraw.f, I would like to get the linear attenuation for Xray in a given material and for a given energy. How can I proceed?
Regards,
Dear Geoffrey,
I understand you want to examine the linear attenuation coefficient (i.e. the photon inverse mean free path) for a given material as a function of energy.
One could consider the following (horribly “hacky”, yet effective) way. Take the following tentative Flair file and mgdraw.f user routine:
mac.flair (1.6 KB)
mgdraw.f (10.7 KB)
Do take a calm look before running anything.
As you can see when you open the input tab in Flair, there is a #define MAT LEAD. You need to change the material name only there and it then propagates through all necessary cards (ASSIGNMA and the two EMFCUT cards). If the material you’re interested in is one of the FLUKA pre-defined materials (see the manual), you change the name in the #define and you’re done. If you need some other material or compound, it’s up to you to define it (see this lecture here), put its name in the #define, and it should fly. The material name in this #define MAT LEAD approach should not contain hyphens. Adapt accordingly if need be.
Note that we put just 1 primary in the START card, and that the BEAM is a photon beam with energy up to 0.1 GeV. The latter is important, as it’s essentially the highest energy you’ll access in your final plot. We have two EMFCUT cards, setting photon production- and transport-thresholds at 100 eV (lowest photon energy in FLUKA, leaving aside optical photons which have a special treatment): this is the lowest energy accessible in your final plot.
Take a look now at the mgdraw.f, in ENTRY SODRAW, which i paste here for completeness (adapt as you see fit):
      ENTRY SODRAW
      IF (NCASE.EQ.1) THEN
         ! Region index (assuming a basic input geo from Flair).
         IREG=3
         ! Material index.
         MMAT0=MEDFLK(IREG,1)
         ! Material density.
         DENS=RHO(MMAT0)
         ! EMF material index.
         MMAT= MEDEMF(IREG,1)
         ! Prepare output energy grid (high number of points to have
         ! halfway decently resolved ionization edges, can be refined).
         NE=5000
         EMIN=1.0D-7
         EMAX=1.0D-1
         ! EMF FLUKA works in MeV for now, so let's convert from GeV to
         ! MeV:
         EMIN=EMIN*1.0D3
         EMAX=EMAX*1.0D3
         ! Let's do a log grid.
         EMINL=LOG(EMIN)
         EMAXL=LOG(EMAX)
         DE=(EMAXL-EMINL)/DBLE(NE-1)
         DO I=1,NE
            ! We save log(E)...
            ELKE=EMINL+DBLE(I-1)*DE
            ! ... and E.
            EKE=EXP(ELKE)
            ! Inverse mean free path in 1/cm.
            XNVMFP=SGTTEP(0, EKE, ELKE, MMAT, .FALSE., ONEONE, ONEONE)
            ! Write out ene (in MeV!), mass attenuation coef (in cm^2/g)
            WRITE(99,*) EKE,XNVMFP/DENS
         ENDDO
      ENDIF
SODRAW is the entry that’s called every time a source particle (or “primary event” to be picky) starts. We say: hey, if it’s the first primary, take region 3 (the target cylinder in the geometry), pick up its material index, density, and EMF material index. We then sweep over energies on a log scale, and spit out two columns to file mac001_fort.99: the energy (in MeV) and the mass attenuation coefficient in cm^2/g, a quantity which is usually preferred, as it has the advantage of being density-independent: the extra division by the density above cancels out another implicit dependency on the density.
NB: in order to make this fly, a couple more INCLUDE lines were necessary (make a diff with the distributed mgdraw.f and you’ll see).
You can now go to the Compile tab in flair and build your custom binary (including this mgdraw.f).
Go to the Run tab and run (1 cycle).
Go to the plot tab and you can take a look. Alternatively, you can take the following gnuplot script:
mac.txt (450 Bytes)
…then run gnuplot mac.txt and you’ll get a plot in PDF like this here, which should be the mass attenuation coefficient for photons in lead:
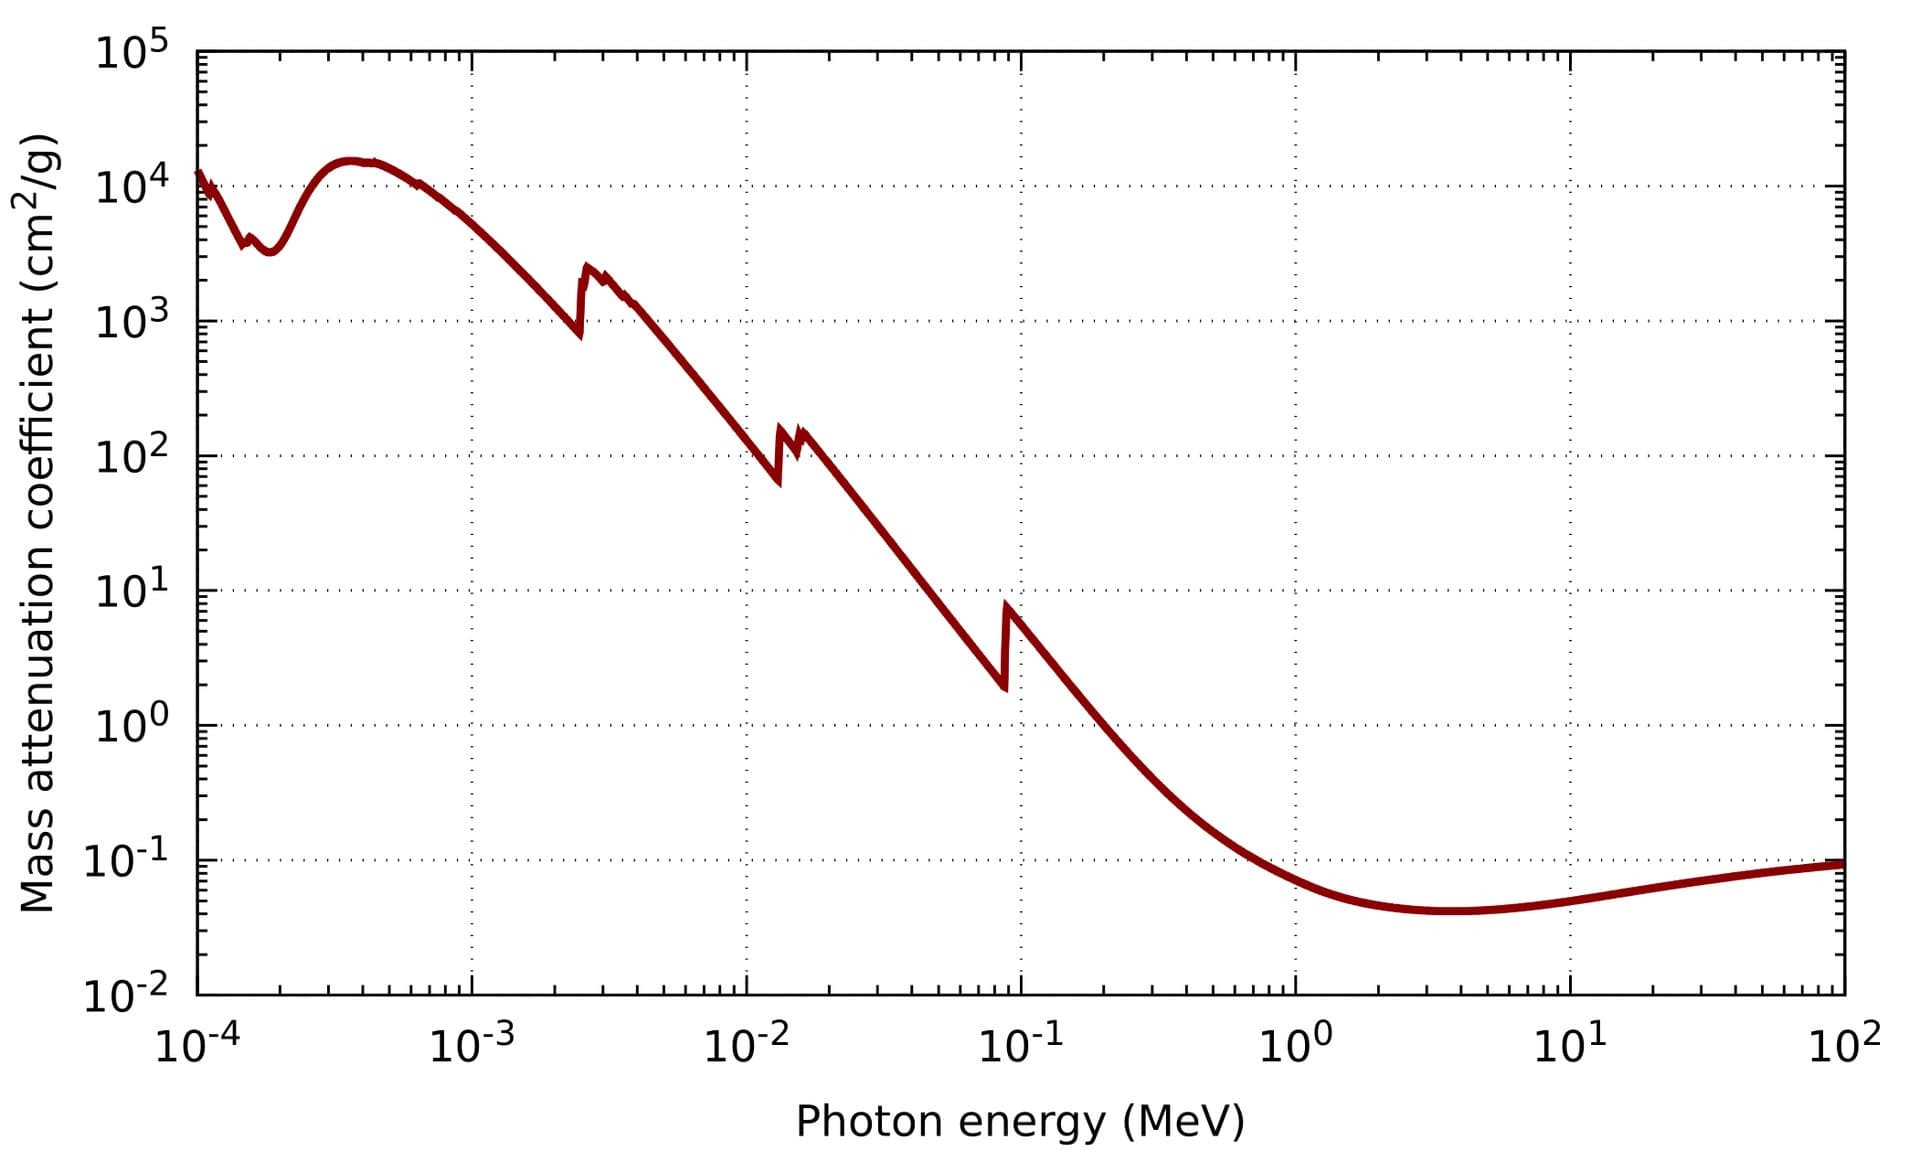
Incidentally, note that the contribution of photonuclear reactions is not included. You can nevertheless look in the output file. You’ll see a table with the inelastic scattering lengths (inelastic mean free paths) for photons, albeit at the beam energy.
Cheers,
Cesc
Thank you a lot for this impressive answer Cesc!
Regards,
Geoffrey.