Hi Shan,
1) About splitting the detector into several regions and using the DETECT trigger to obtain multiplicities
You can use the trigger/anti-trigger mechanism to select events based on activity in another region, but DETECT cannot provide a true photon-multiplicity measurement.
DETECT only integrates the total energy deposited in its scoring region during one primary history. It does not track how many photons entered the region, how many separate interactions occurred, or which sub-volume was hit.
Even if you divide the detector into multiple volumes, each DETECT card still produces one energy value per region per event, and the trigger only acts as a yes/no gate.
You cannot reconstruct a distribution such as “M = 1, 2, 3 photons per event” from these quantities. At most, you can implement simple coincidence requirements (region A AND region B), but not a robust multiplicity spectrum across many detector elements.
2) About “implementing a realistic source volume”
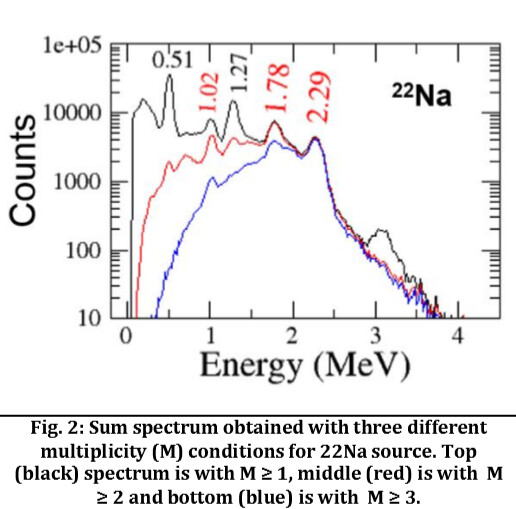
For a 22Na source, the decay produces a positron which slows down in the source material, annihilates, and produces the two 511 keV photons (plus the 1.274 MeV gamma).
If the decay occurs in vacuum or directly inside the detector, the positron’s kinetic energy is deposited in the detector and the annihilation occurs too close to the crystal. This strongly alters the spectrum and smears the characteristic peaks.
A realistic setup should therefore include a small source volume (and optionally its capsule) located between the detectors. Decays should originate inside this volume so that the positron loses energy and annihilates in matter before the photons reach the detectors. This brings the simulation much closer to an experimental configuration and produces the expected spectral features (annihilation peaks).
3) Why a user routine such as mgdraw is better for this task
DETECT is convenient but limited. It gives you one accumulated energy value per region per event, with very restricted logic.
With mgdraw you have access to the full event history. This allows you to:
- accumulate energy depositions per event exactly as you want,
- distinguish contributions in different detector sub-volumes,
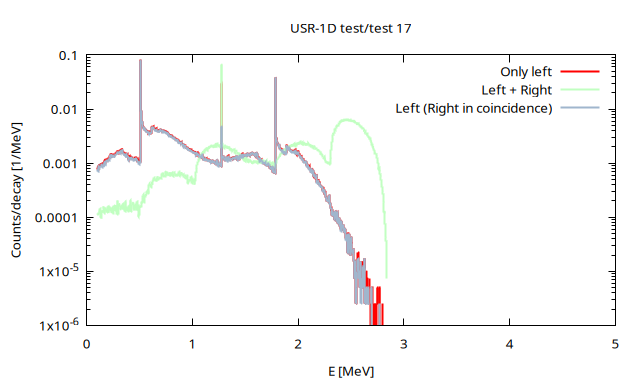
- implement your own coincidence and multiplicity criteria,
- build sums such as E_left + E_righ for coincident events,
- output one line per event with all relevant information.
This is not an easy task by any mean. You can find more material in this presentation: https://indico.cern.ch/event/1200922/contributions/5411856/attachments/2662688/4613294/10_MGDRAW_routine_2023_Advanced_ANL.pdf