I am a beginner at Flair and just started learning it a few weeks ago. I am trying a simulate a NaI(Tl) scintillator detector and obtain the energy spectrum for a Cs-137 source. My assigned values seem to be correct but my runs always end abruptly with a TIME-OUT error. I believe it might have something to do with the way scoring is handled. Kindly let me know if there are any errors in my definitions.
Your simulation was ending abruptly because of the missing WHAT(1) in your OPT-PROD card, corresponding to the wavelength of the scintillation photon. According to this website, but please search for yourself a better reference/source, the wavelength in Na(Ti) should be around 4.15e-5 cm.
The DEFAULTSPRECISIO imply a 100 keV threshold. For your Cesium source with a peak at 661 keV, this might be too high. I have taken the liberty to add two EMFCUT cards, thereby lowering the thresholds to 10 keV, but feel free to consider even lower limits. Please note the minima from the manual: “The minimum threshold energy for transport and production of photons is 100 eV. For electrons and positrons, it is 1 keV.”
If you want to obtain the energy spectrum MEASURED by your detector, this depends on the readout system that you have, i.e. are you measuring the total energy deposited in the material, or just the scintillation photons? If the former, you would not even need to activate the scintillating physics (i.e. the optical photon cards) as the simulation would give you the energy distribution of the Cesium source in the material.
You have correctly added a DCYSCORE card for the USRTRACKs, but you should add them for every scoring card (i.e. also for USRBIN).
The USRTRACK card will measure the energy expressed in GeV per cm2. Please read carefully the first two notes of the manual about the USRTRACK card. A better suited scoring card for your case would be the DETECT card.
The USRBIN card will give you the average energy deposited in a spatial mesh, but not the energy distribution.
Please find attached your file with the changes mentioned above. scint_1.inp (2.7 KB)
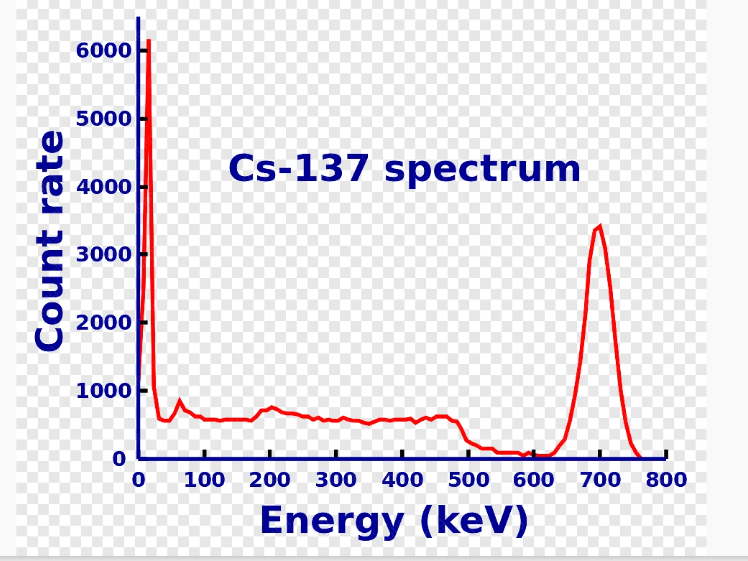
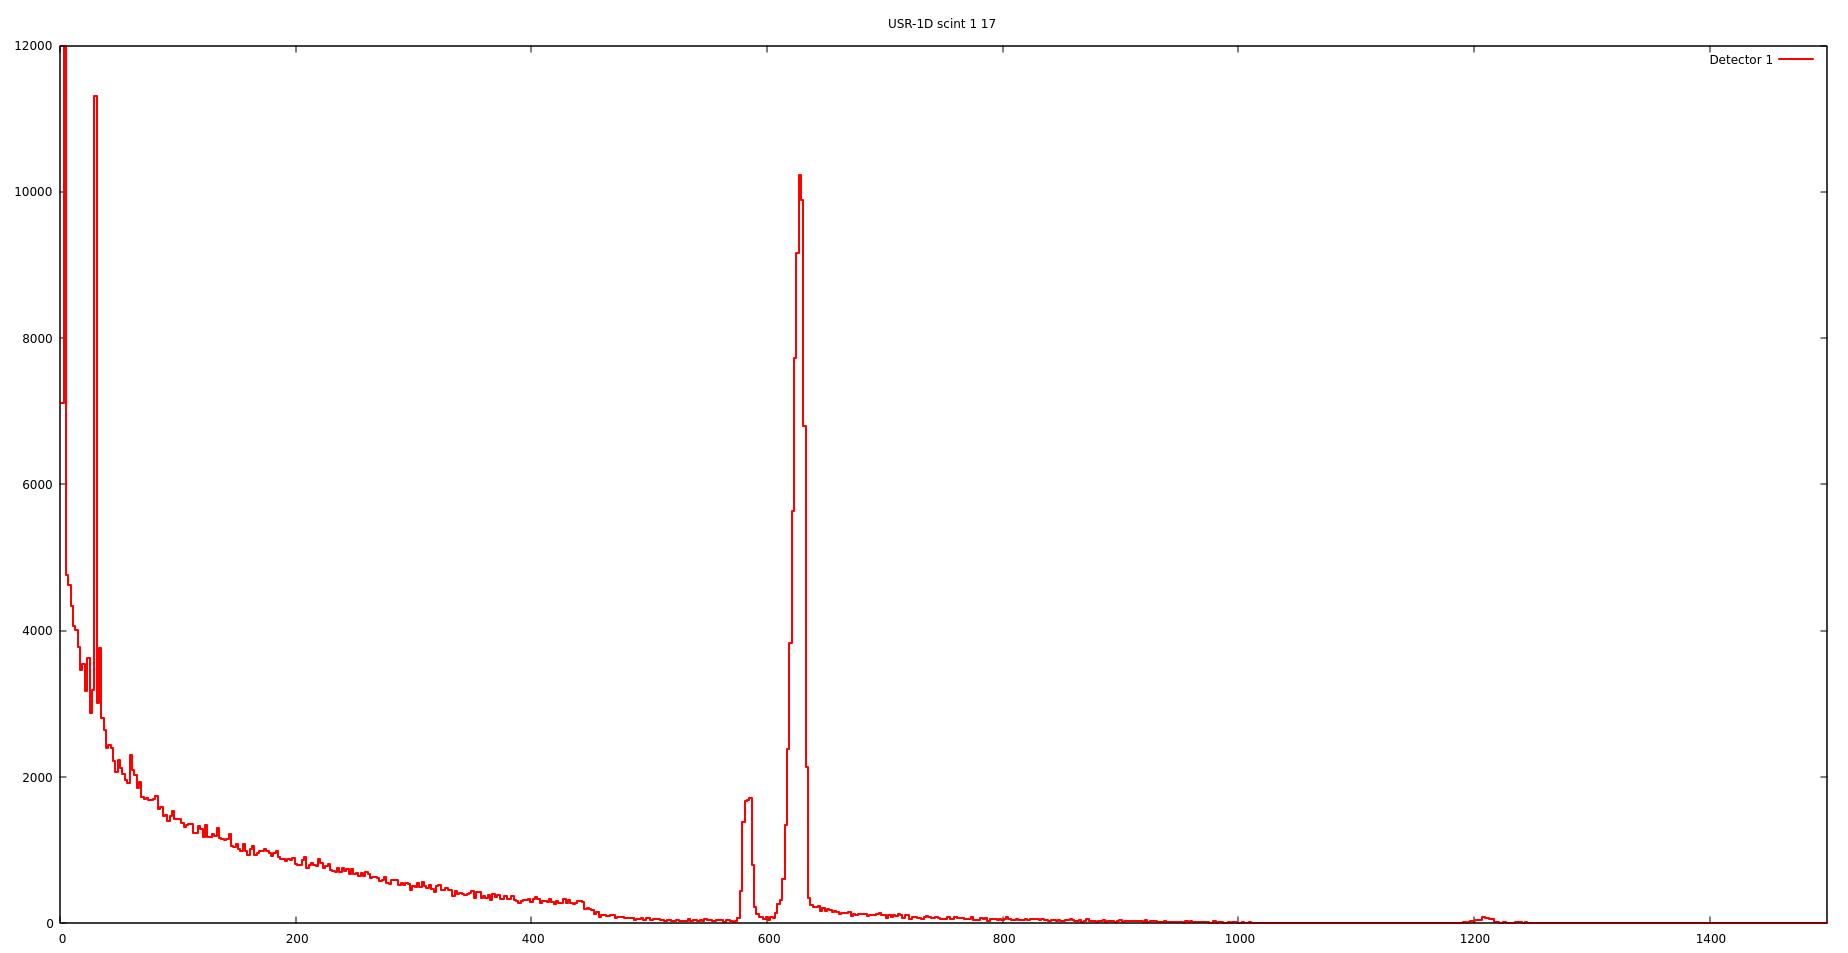
From what I understand, the DETECT card should be able to produce the scoring data needed for the spectrum. The shape of the spectrum seems to largely correct, however the peaks don’t correspond to the right energy values. The 662 photopeak clearly appears to be shifted in the plot
I observed something similar when I changed the source to Co-60. I will share the generated plot for Co-60 here if needed.
I also made some changes to the input file after looking through a few similar discussions on this forum. Apologies if some of the changes seem random or arbitrary. scint_1.inp (2.8 KB)
Kindly let me know if you can figure out what is causing this and thanks for your continued help @dprelipc
As a general rule, do not add cards in the your FLUKA input if you are not familiar to them or do not understand their usage, as they might significantly impact your results. In particular, for your case, you do not require the PHOTONUC as the energy of your photons is too low to trigger photo-nuclear effects ( with a typical threshold at ~7–10 MeV). Similarly, you do not require the COALESCE and EVAPORATPHYSICS cards.
To obtain the “pure” Cesium energy spectrum, you can follow the strategy from this question, similar to yours.
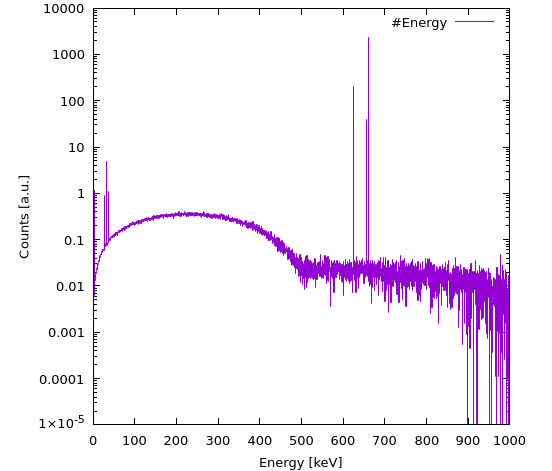
If you set every region to VACUUM and score the energy of the decay products, you should obtain a spectrum following the database.
Predominantly, you get the expected 660 keV photon peak, but also a 624 keV electron peak, as obtained below from this scint_1_v2.inp (2.7 KB) file.