Dear FLUKA experts,
I am studying the irradiation of a TISSUEIC target and recording the secondary emitted particles with the card DETECT.
I want to verify that makes no difference in terms of output DETECT spectrum using either a direct scoring (just DETECT) or a two-step scoring (1. photon, neutron, 4-He, 3-He, deuteron and triton features are saved in a phase space file thanks to the entry “bxdraw” of mgdraw routine; 2. These particles are emitted with the routine “source_newgen.f” and detected via DETECT).
The input file of the two simulations is just the same concerning beam characteristics and position, geometry, physics, thresholds and scoring (see attachment).
I normalized the data coming from the two-step scoring multiplying them by the ratio of total weight of particles scored by DETECT and the number of primaries in the first step simulation (using the mgdraw routine).
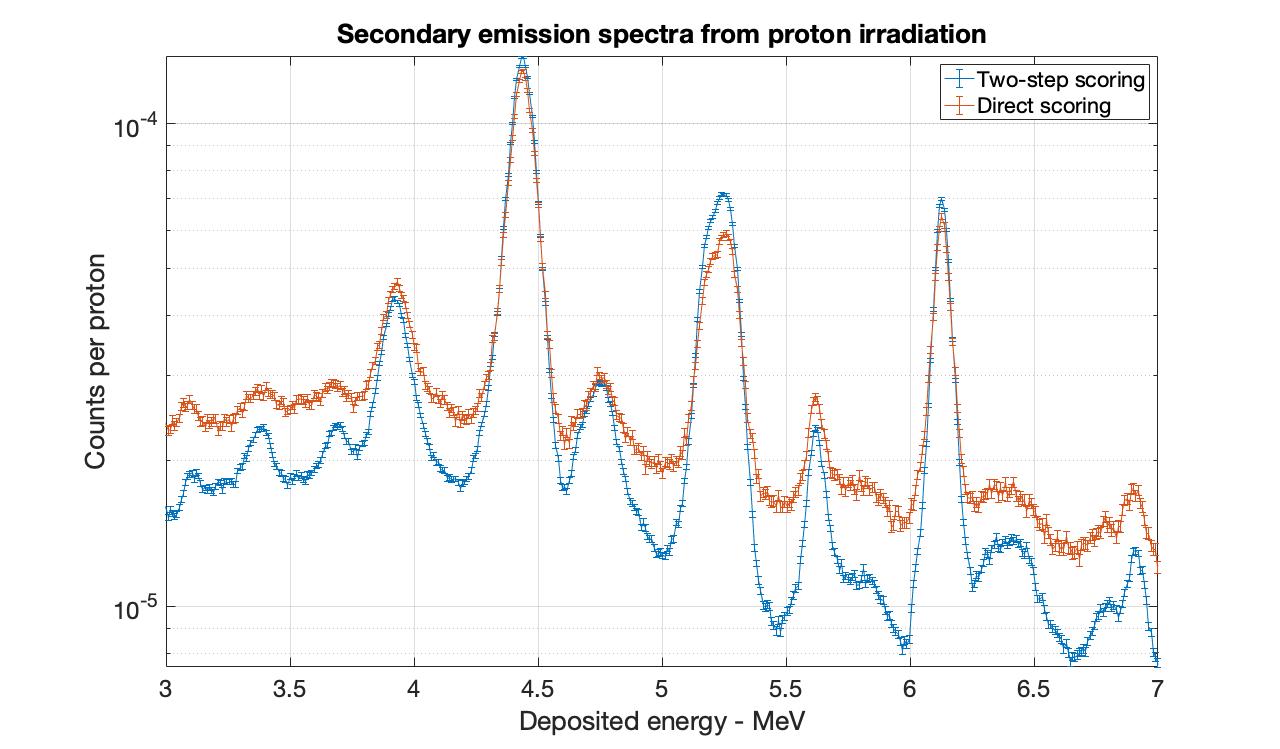
From the attached image “Graphical_results.jpg”, one can see that the peaks are well represented but there are regions around these peaks that show a lower background for the two-step approach. How is it possible? It seems that an additional background is missing. Is the problem related to the entry “bxdraw” and how I selected the region?
after a quick look at your input files and source routines, I noticed that you don’t include the electrons and photons above 10 MeV (and all the other particles) in the second step of the two step simulation. This may explain the missing “background”.
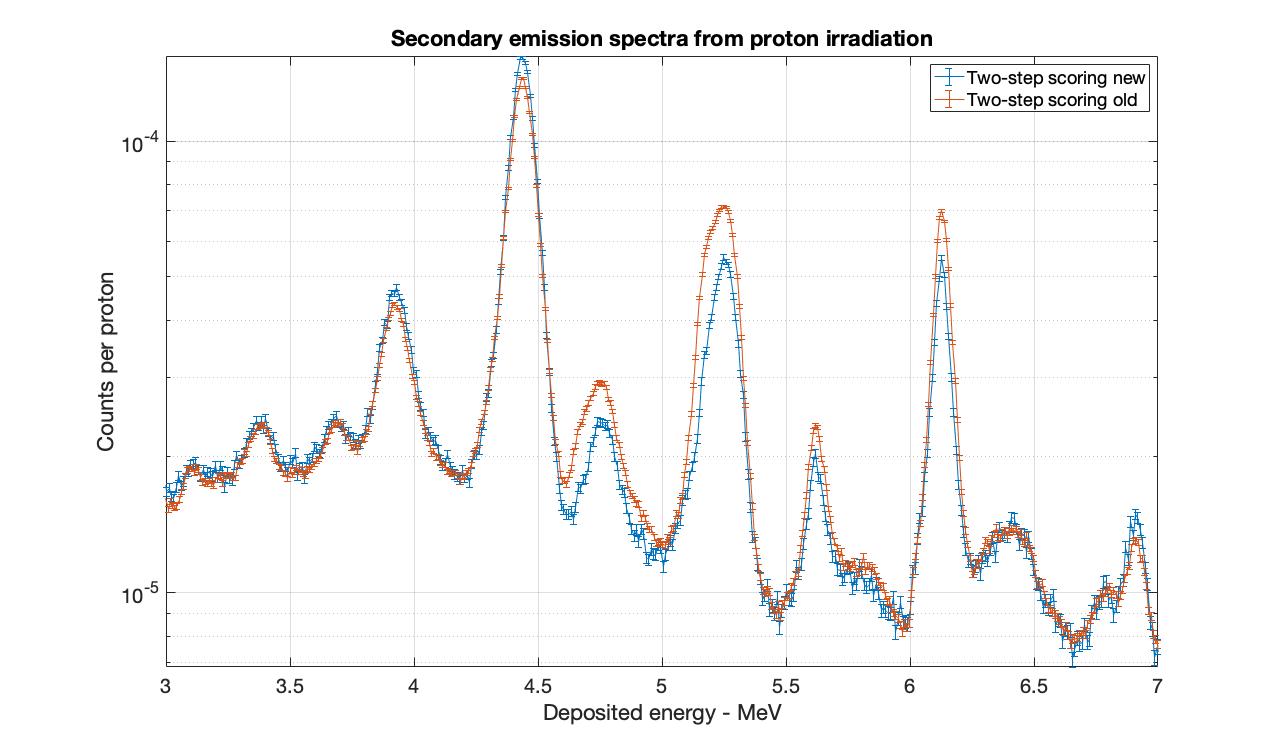
I updated the mgdraw.f like in attachment: I removed the interval 0 to 10 MeV for photons and I also scored electrons. I repeated the simulation but the results are practically the same as above (see the below figure).
I redid your simulation with a simplified set-up. Instead of two separate second step I used only one.
In this case the results from the direct and two-step simulation match.
I’m guessing your issue is with the normalization, but you didn’t specify how did you merge the two second steps, so I can’t be sure.
I first did a simulation using protons as primary particles with “direct” scoring using DETECT.
In a second simulation, with two separate MGDRAW routines I scored the phase space quantities of photons+electrons and neutrons+hadrons using a number of primary protons which we may call N_proton. The total number of photons+electron inside the associated phase space file may be called N_ph_e. Similarly, the number of neutrons+hadrons will be called N_ha.
Then, I separately ran two simulations: One using the photon+electron phase space file and the other one using the neutron+hadron phase space file. For each simulation, I obtain the output of the DETECT card which displays counts per unit primary weight (which in this case is the same as counts per unit primary particle). Let’s call D_ph_e and D_ha the resulting distributions of these simulations. To obtain the results per unit primary proton I did this: D_proton = D_ph_e(N_ph_e/N_proton) + D_ha(N_ha/N_proton)**
Comparing D_proton with the results of the “direct” simulation, the results do not match as shown above.
With the mgdraw user routine you print the ETRACK variable, which stores the total energy of the particles, but the source routine expects the kinetic energy.
This discrepancy causes to simulate neutrons with ~ 1 GeV kinetic energy in the second step, creating much higher energy deposition, than your DETECT scoring.
To get the kinetic energy in mgdraw you need to print
ETRACK - AM(JTRACK)
where AM is mass of the JTRACT_th particle in GeV.