Versions
Please provide the used software versions.
FLUKA:fluka_4-5.0.
Flair:flair_3.4-2
Operating system:ubuntu24.04
Description
Data
-
USRBIN Unit 51 (
pifluBin) —ENERGY, accurate apportioning algorithm (WHAT(1)=10.0, Cartesian) -
Grid: X −10..10 (NX=20), Y −10..10 (NY=20), Z 0..5 (NZ=5)
-
After
usbsuw/usbreaI havepifluBin_sum.bnnandpifluBin_sum.lis(the.lisvalues look correct).
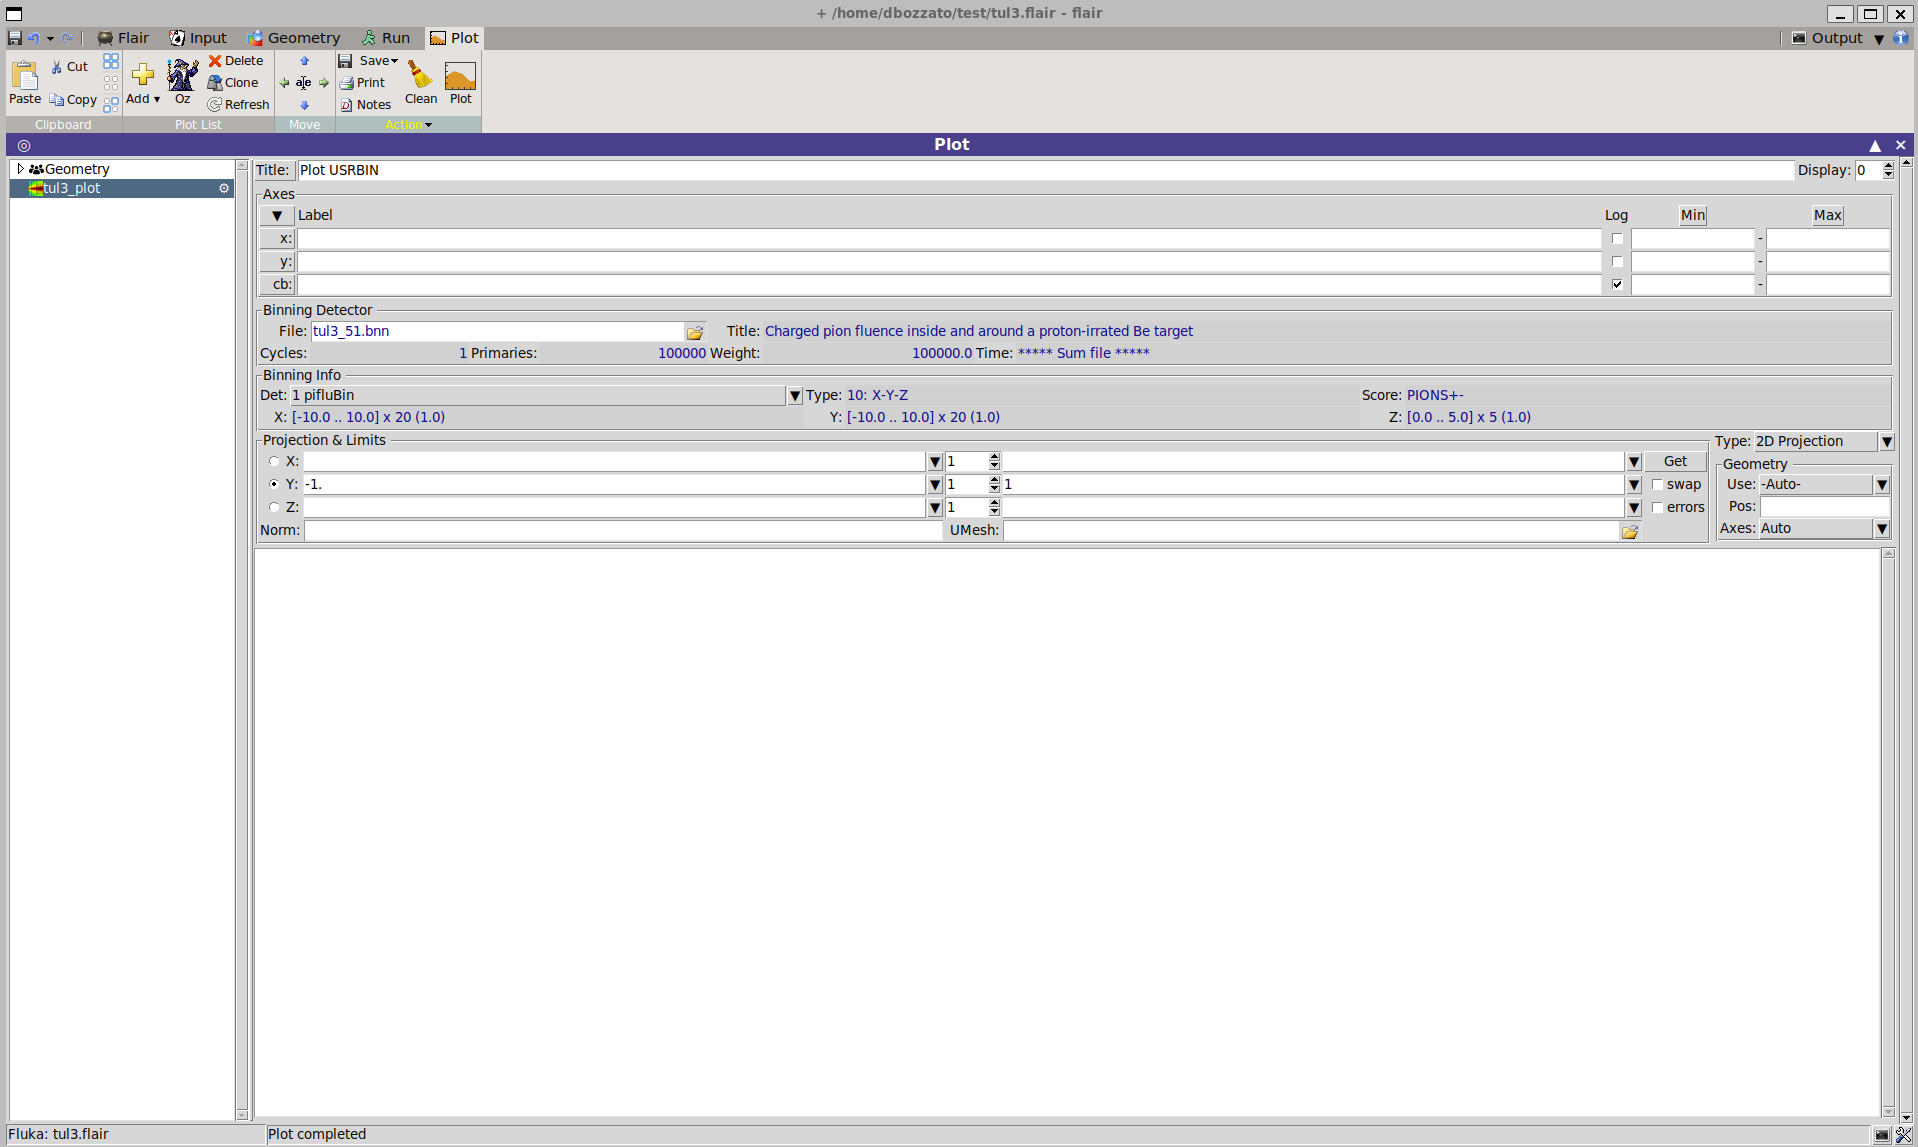
What I want
- Display the result on the X–Z plane, e.g., a Y = 0 cm slice.
What I tried & the error
-
Plot tab → File:
pifluBin_sum.bnn -
Projection & Limits: X
-10 1 10, Y-10 1 10, Z0 1 5 -
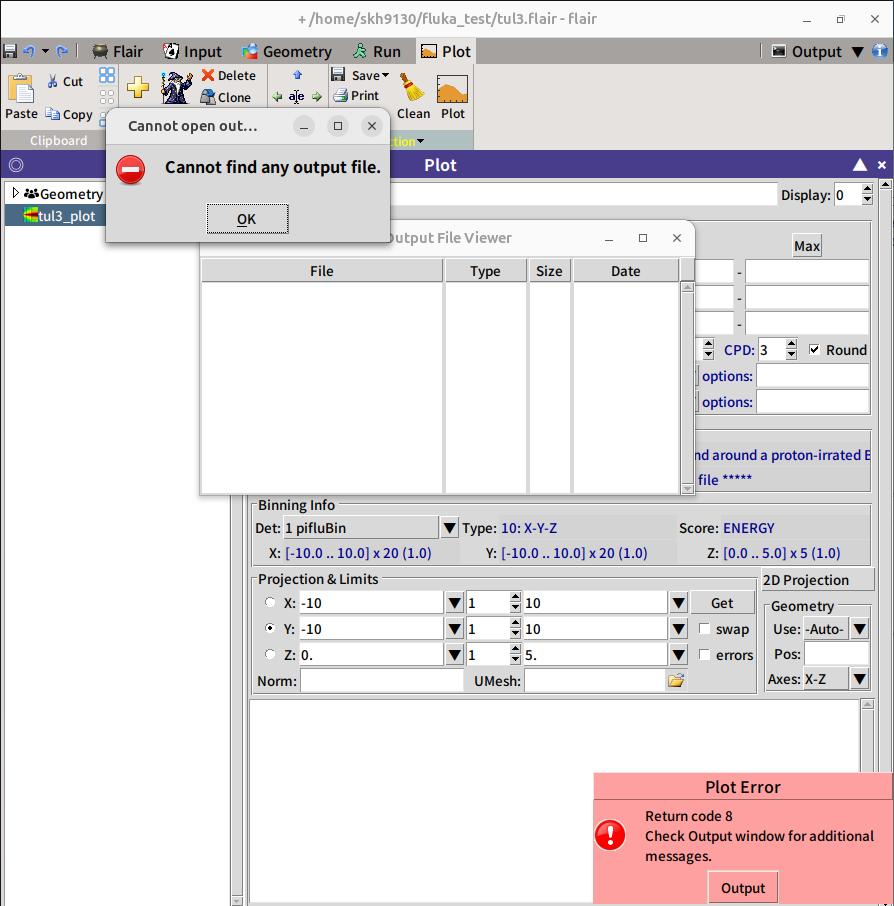
With the Z radio button selected (fix Z) and Axes: X–Z, clicking Plot gives
Plot Error: Return code 8.
If I keep Z radio but set Axes: X–Y, the XY slice draws fine. -
Pressing Output (bottom-right) also pops up “Cannot find any output file.”
Questions
-
What is the correct combination of the fixed-axis radio button and the 2D Axes setting to draw an X–Z slice?
My understanding is it should be Y radio (value = 0) + Axes: X–Z. Is that correct? -
What exactly causes “Return code 8” in this context—mismatch between the fixed axis and Axes selection, or an out-of-range slice?
-
Does the “Cannot find any output file” popup relate to plotting at all, or is it just the Output viewer not finding a log/output file (and therefore safe to ignore for plotting)?
I can attach screenshots of the Plot settings, the .lis header/data, and both popups if helpful.


Input files
Please upload all relevant files. (FLUKA input file, Flair project file, user routines, and data files)