I am running a simple testing setup which protons targeting a water block with some polyethylene shielding under WSL through Flair. I have defined a USRBIN estimator with region binning to specific looking at the dose in the targeted water block. The test finished OK yet I could only see a bunch of gibberish when I try to read the .bnn file produced. How should I proceed to access the result?
I followed your suggestion and tried to plot the .bnn file. I do get a plot.dat file even though that every type of plot I tried to produce will generate a pop-up window saying “Gnuplot error”.
If this is the file you are referring to, how do I decipher it? I tried to go through FLUKA manual yet no luck in finding the answer. Could you tell me what each column is about?
The attached is my plot.dat file, produced by choosing 1D Projection.
P.S. If I am only interested in the dose in one region. Do I have to choose “R1from:” same as “R1to”? Cause I left “R1to” blank at first, the data is always zero no matter how I change my source energy or shielding depth.
You selected a scoring type that is not suitable for plotting, because it does not provide a regular spatial distribution, rather a single scalar that is the quantity averaged over one region (along with the associated statistical uncertainty).
Moreover, note that region volume is not known to FLUKA, so in this case the resulting DOSE is actually (GeV * cm^3 / g) per primary, to be further divided by the region volume.
To elaborate a bit on this: when scoring with a USRBIN by region, the volume of the arbitrary region(s) contributing to the active region set is (for now) unknown in general, so information is missing to properly normalize. Thus, if you scored ENERGY you’d get a quantity in GeV/primary. Incidentally, this would match the output of the SCORE card in the output file.
Dimensionally, to obtain dose one would start from an energy density (GeV/cm^3/primary) and divide by the mass density (in g/cm^3) to get dose in GeV/g/primary. But, since the region volume is unknown, you’d start instead from an energy in GeV/primary and the division by the mass density would give you dose in GeV * cm^3 / g / primary.
These are the somewhat funky units in which your score dose is given in the 4th column of the screenshot. The 5th column is the relative uncertainty (1 would mean 100% uncertainty). You’d still have to divide by hand by the region volume.
Regarding the need to enter “R1to:”, in the manual you will see that there is no explicit default, hence one has to enter it. Indeed this is not usually the case when specifying “from” and “to” ranges in other cards, because for those cases there is a default value (effectively to=from).
Cheers,
Cesc
PS: you can use the command-line tool usbrea. It will ask you for the input bnn filename and an output filename of your choice. There you will see a slightly more verbose output (and the error quoted as a percentage instead).
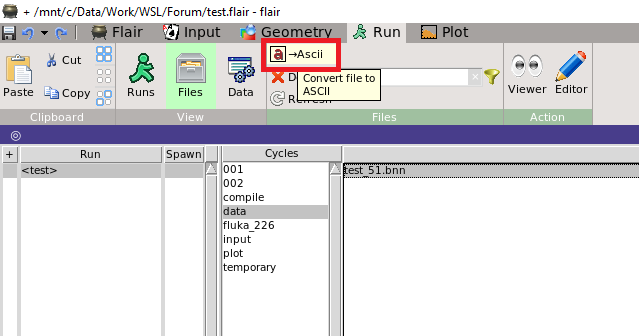
in addition to @cesc’s answer. You can convert a processed binary result to a readable text file with Flair as well, using the -> ASCII buttion on the Run/Files tab, as shown on the picture below.