I am using the USRBDX to score the electron spectrum with respect to their energy on some planes through my water target, with a incident electron beam. I can plot the electron spectrum, while I found it is hard to calculate the spectrum width or sigmaE.
Do you have any idea to calculate it? it is also helpful if there is any method to score the electron energy distribution spread through a certain plane. Thanks.
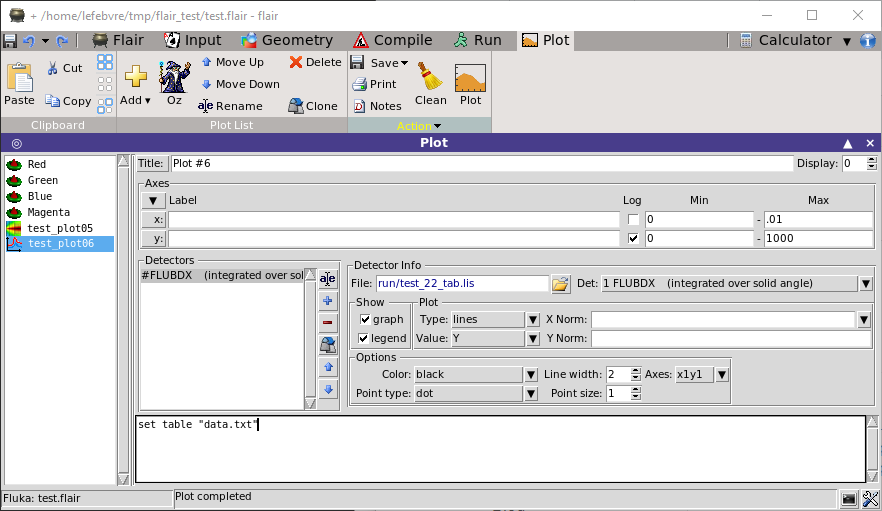
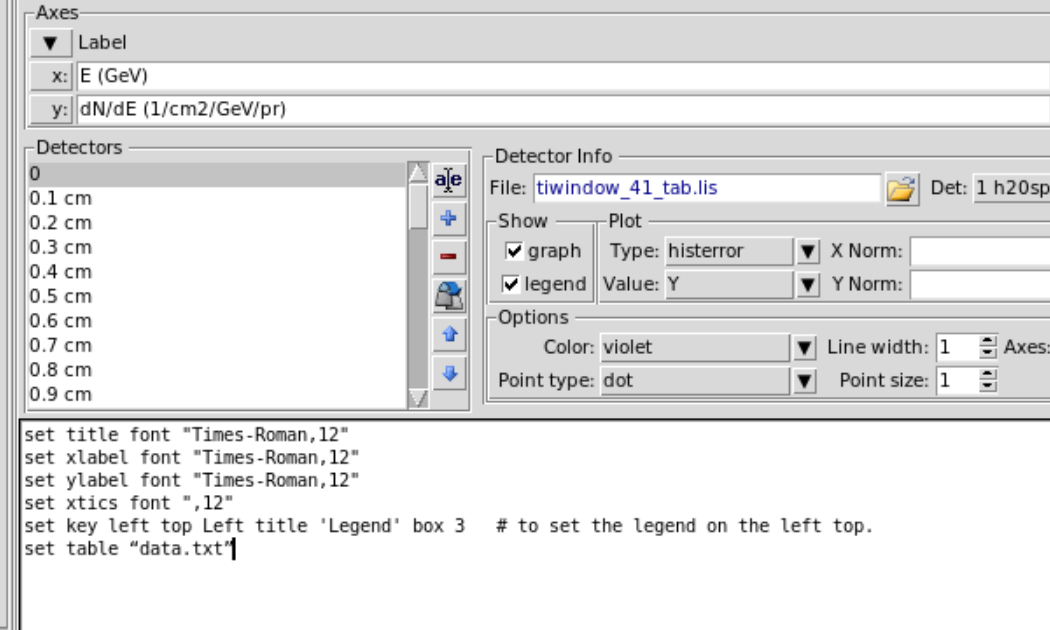
You can extract the data of a flair graph or histogram by using gnuplot commands in the flair plot tab. For example add the command:
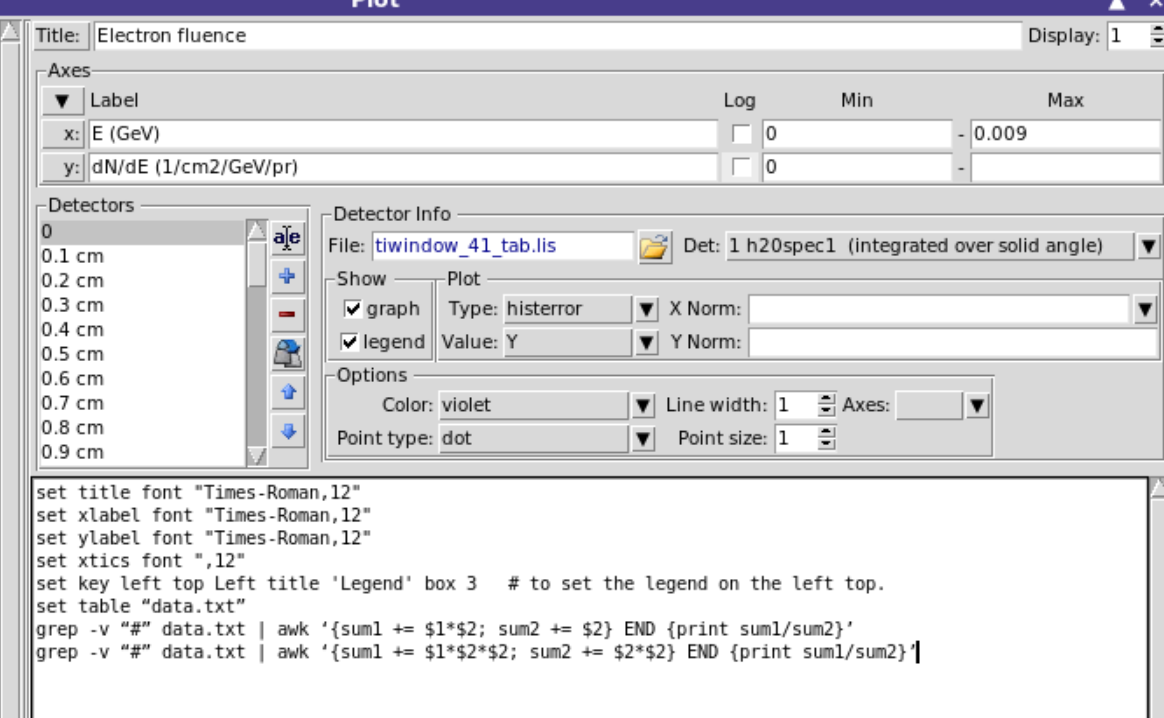
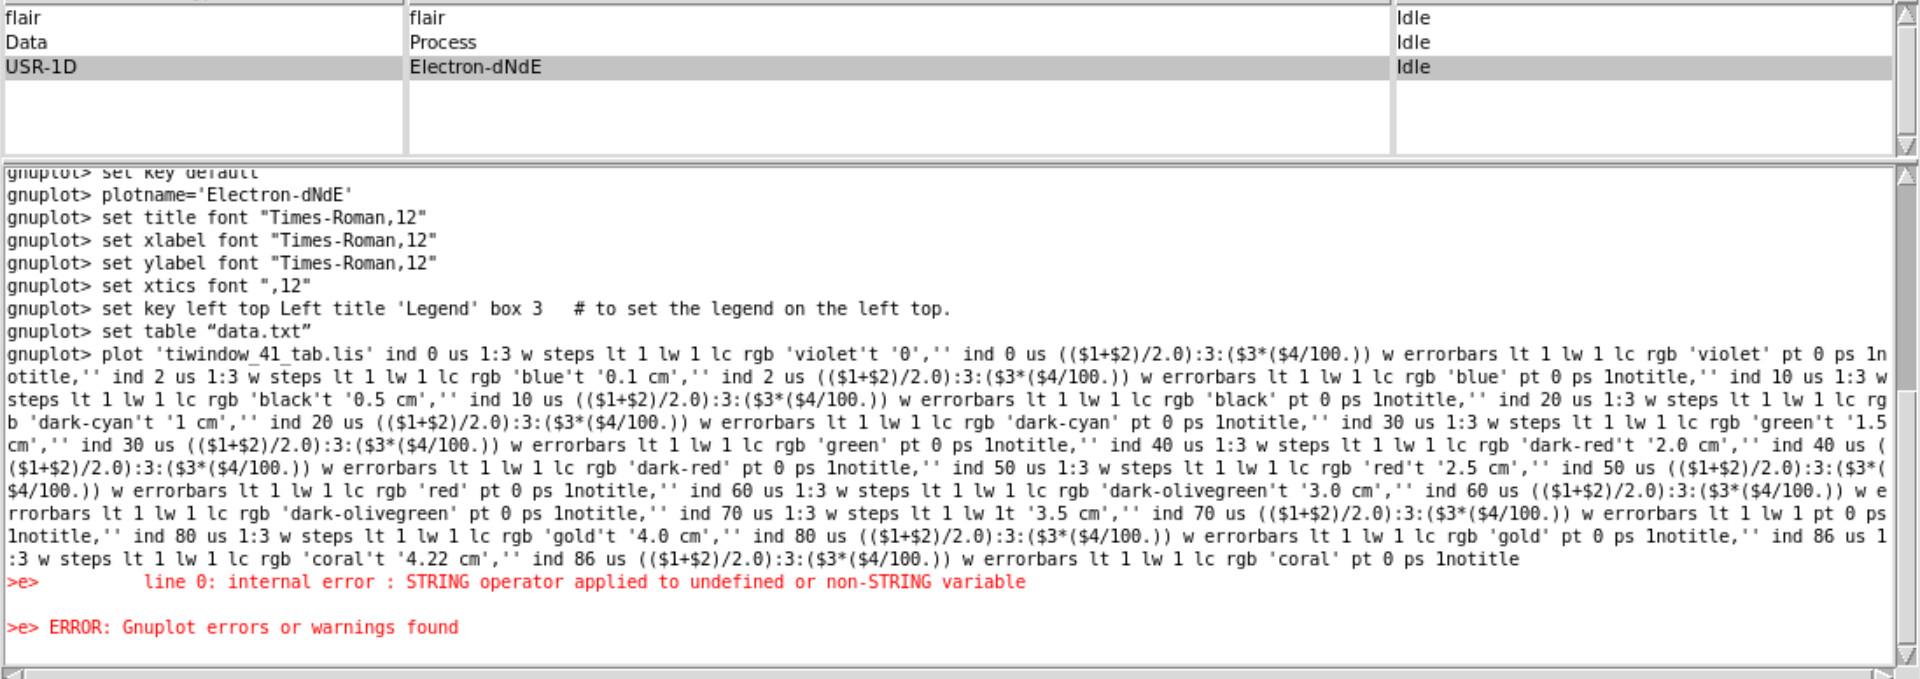
set table “data.txt”
to the command box (see screenshot) then click the “Plot” button to create the plot. You will find the file “data.txt” in your project directory which contains the coordinates of the graph or histogram points.
If your plot is an histogram, the mean would correspond to SUM(X_i*Y_i)/SUM(Y_i) with taken as X is the bin center and Y the bin content. You can calculate that directly using the command:
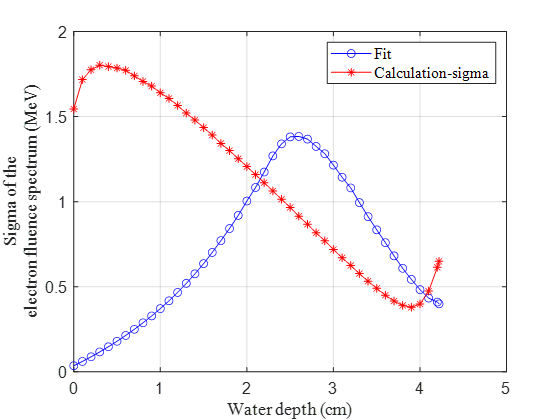
In fact, I have used two methods to get the mean energy and energy spread for every different planes (it is the water depth in my case). One is to use the Gaussian fitting, the other is to calculation them with the tab.lis file. Please find my flair file tiwindow.flair (50.6 KB). Sorry that I couldn’t upload the big tiwindow_41_tab.lis file due to the large size.
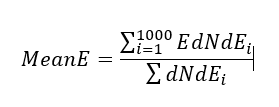
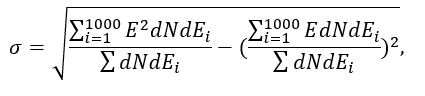
The formula I used are
E is the X axis value and dNdEi is the Y axis value in your explanation. I guess you might mistake the $2 as the X values (E) and forget to subtract the mean value for the RMS calculation.
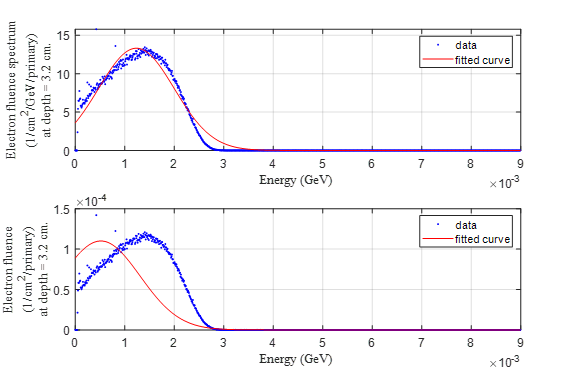
The fitted curve formula is
val(x) = a1*exp(-((x-b1)/c1)^2)
b1 is the mean energy and c1 is the energy spread. It looks like
What I care more is the sigmaE (energy spread), I compared the results by these two methods.
The fitted results make sense while the calculation doesn’t, I think the reason should be that the calculation is based on an energy range which is not the energy for every particle. While the fitted curve is not always perfect, so I am wondering if there is a direct way to get the energy spread. Thank you.
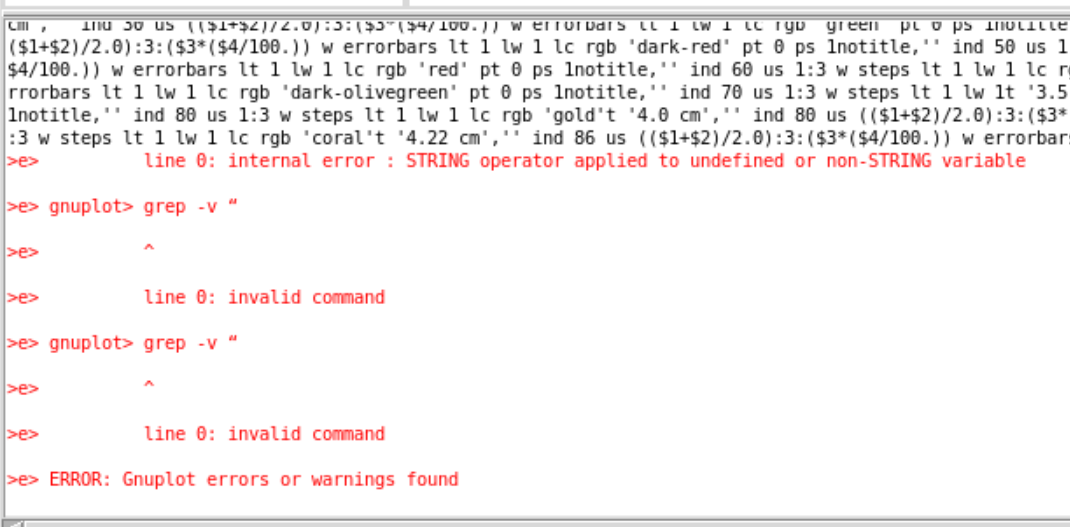
You have to first generate the plot with the “set table” command in Flair. And then, after that, you run the grep command in the system’s command line (cd in the project folder first). The file “data.txt” is created after the plot is generated, which in your case did not happen.
In general the standard deviation obtained from the fitted parameter of a Gaussian function and from the second central moment is different. If the distribution doesn’t look Gaussian, or if the distribution is truncated, as in your case, you can expect to obtain very different values.
The formula I provided is for the root-mean-square (non-central moment), your formula for sigma is also correct (although the dEi values likely cancel out if your binning is linear). I suggest that you carefully consider what variance estimator is the most appropriate for characterising your simulation results.
For the standard deviation, I agree it is different from the fitted Gaussian function, However, the trend by these two methods should be consistent with each other I think.
I am expecting the second central momentum. And I guess in your RMS formula, you might want to use sum(X_iX_iY_i)/sum(Y_i) instead of sum(X_iY_iY_i)/sum(Y_i*Y_i), didn’t you? Cause X_i is the centered energy for every bin, Y_i is the dN/dE.
It looks like the character in the command box isn’t exactly a quote ("), probably due to a combination of copy-and-paste and this forum’s text formatting. Try typing the command directly in the box.
Also you are right, for the RMS is should be XXY (not XYY). So in the earlier reply I meant to say: “replace $1 with $1*$1”.