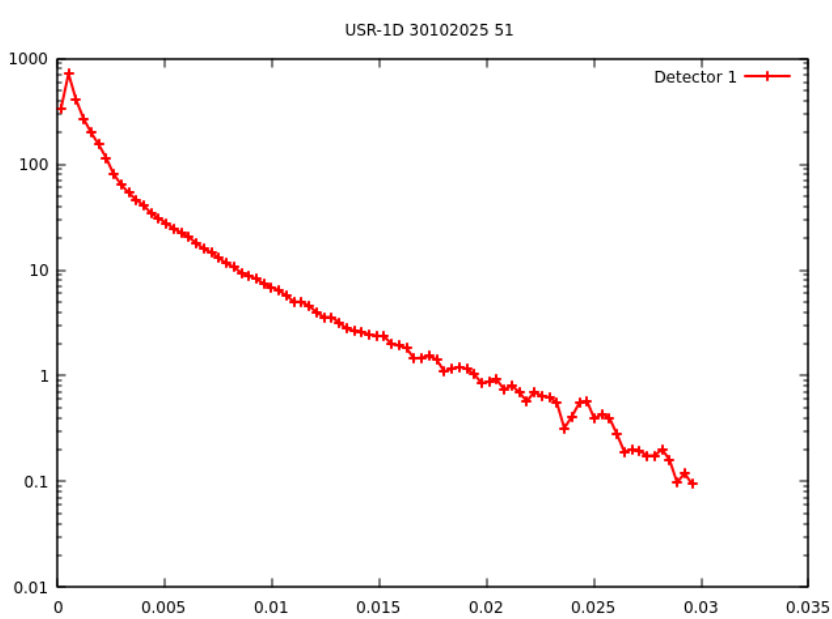
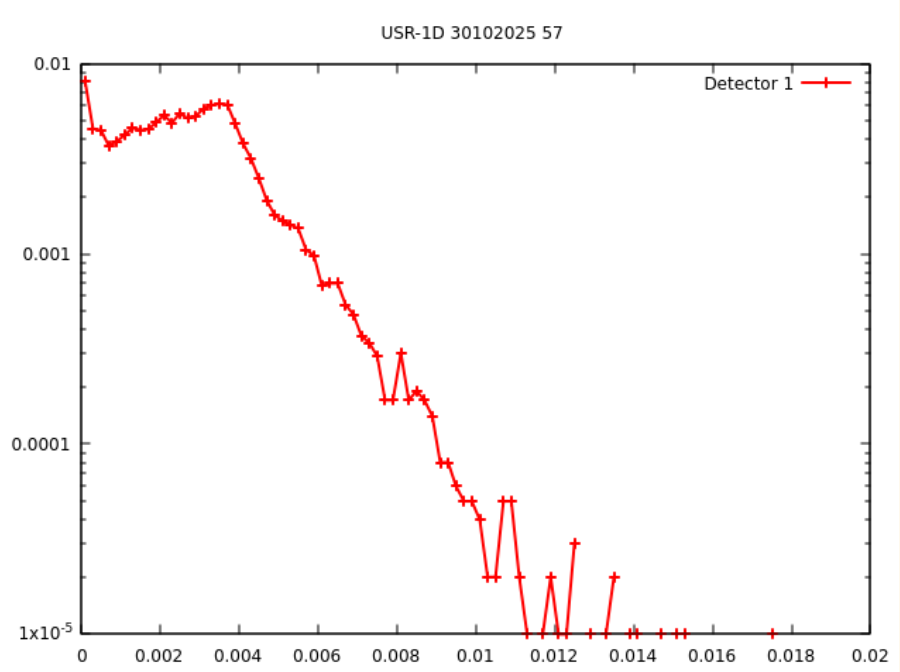
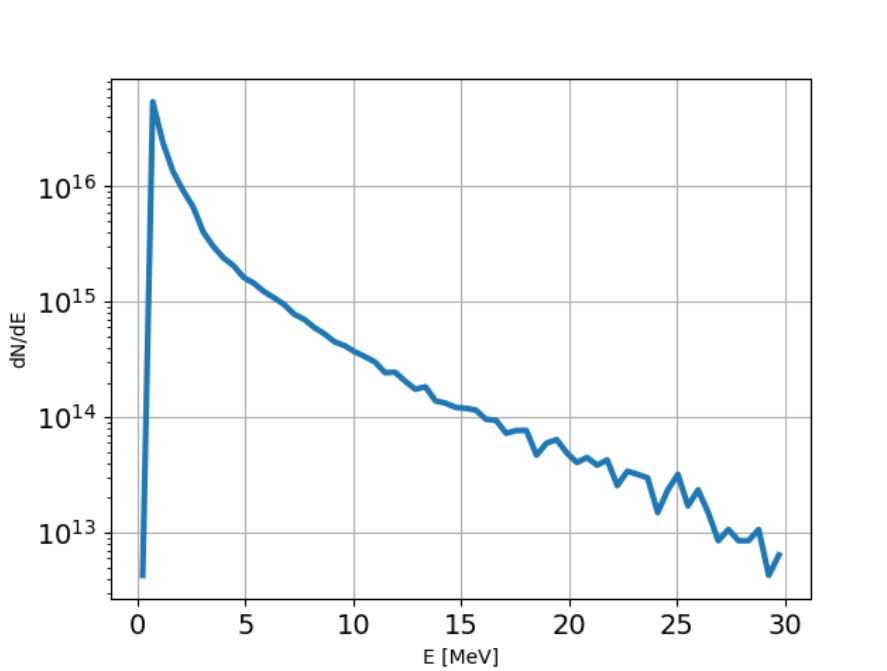
I have a similar question regarding the normalization procedure for USRBDX output to obtain the actual particle counts crossing (one-way current) through a surface between two regions. I ran the simulation for a total of 5E08 primaries (5 cycles) and obtained the following plots (without applying any normalization factor) for both the input proton spectrum (from a user-defined source; spectrum file attached) and the resulting alpha particle yield (both red plots). But I have two queries:
How can I determine the normalization factor so that the Y-axis of the plots represents the actual number of protons (or alpha particles) crossing the boundary per energy interval? Basically, I want to replicate my original input proton spectrum (attached image; blue plot).
If such a normalization factor is obtained for the proton spectrum, can the same factor be applied to the alpha particle plot as well? Or will it be calculated differently?
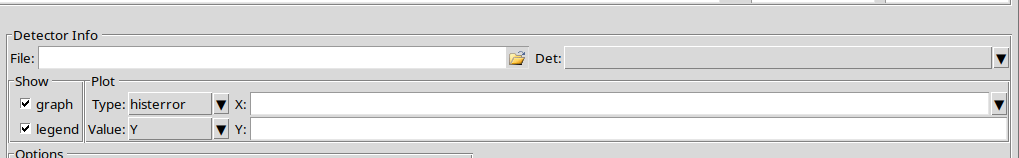
Your simulation results are always normalized per primary particle (or per primary weight). To normalize to a value other than that, you can use the “Y” field in the plot tab:
Thanks for your reply. What normalization factor should I enter in the Flair “Y” field so that the USRBDX proton spectrum exactly matches the input source spectrum (dN/dE vs E from data.txt)? In other words, how do I scale the USRBDX results (which are per primary) so that the plotted curve reproduces the original source distribution? Once this normalization is determined for the proton spectrum, how should I apply the normalization to the USRBDX alpha spectrum so that the alpha yield is plotted consistently with the normalized proton input spectrum? Thank you.
I see that your scored spectrum seems to peak at 600 \; \text{GeV}^{-1} while the input spectrum peaks at 6 \times 10^{16} \; \text{MeV}^{-1} (not being sure of the units). So for the scored spectrum to match the input spectrum, you would need to input a factor of about 10^{17} in the Y field.
Ideally, you should numerically integrate your input spectrum (assuming its scale has a physical meaning, not arbitrary units) to precisely obtain the total number of particle. This would be your normalization factor Y.
Thanks for your prompt response. Just one more doubt. Whether the same factor (10^17) is valid for normalizing the 2nd plot (alpha particle spectrum) since it depends on the input spectrum of protons?
All results are normalized per primary particule (or primary weight). If you want to normalized scored data for a different number of primaries, you need to do it for each detector individually in flair.
So yes, the factor 10^17 should also be applied to the alpha spectrum.