Dear fluka expert,
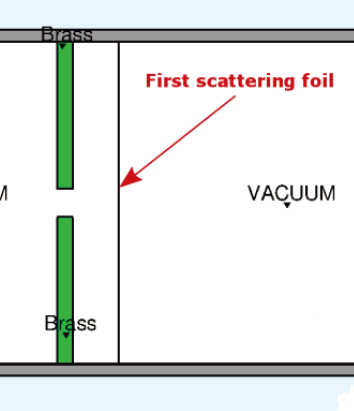
I have built a model to simulate the reaction process of protons along the positive z-axis. I want to obtain the proton distribution of the particles after passing through the First scattering foil in the figure, and judge whether it is Gaussian distribution.

My initial idea is to use the USRBIN card to limit the z-axis area to a short section on the right side of the First scattering foil, and then draw a one-dimensional curve to verify whether the curve satisfies the Gaussian distribution. But I am not sure whether this method is accurate, I hope you can give me some guidance and help.
I have another idea, which is to count the particle distribution in all z-axis regions, and then choose the value range of z to be on the right side of the first scattering foil when drawing. I also question the accuracy of this method of taking a range. And I think this method may not be as accurate as the previous one.
Dear @luo.luo,
Assuming you are referring to the spatial distribution of particles then a USRBIN will indeed do the job. Then you can use the Plot capabilities of Flair to make a 1-D projection of the USRBIN data to verify the Gaussian distribution.
Kind regards,
Francisco