Parameter setting: I use proton beam or electron beam to debomb the copper or tungsten target, irradiation for 10min and cool for 1h to obtain the radionuclide produced by the target, and a nuclide map will be generated. But in practice, my radionuclide map generates only one nuclide. My current idea is as follows: I put the 1h cooling time split a lot, each interval cooling time corresponds to a detector, then I get the data under different cooling time, because I think about combine these data together, and then output a whole, you can get complete radionuclide diagram, but I will not merge the data generated by different detectors or even combined also not necessarily get complete radionuclide diagram.do you know how to merge?
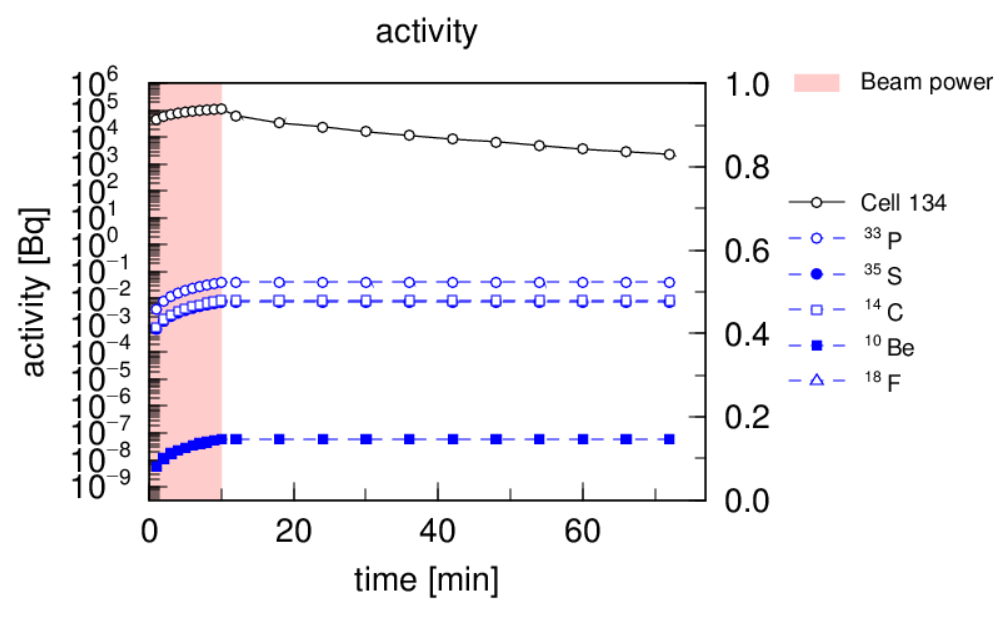
Second question: How do I get a diagram of the activity of a radionuclide over time (as shown below)
many thanks and welcome for joining the FLUKA Forum !
To your first question:
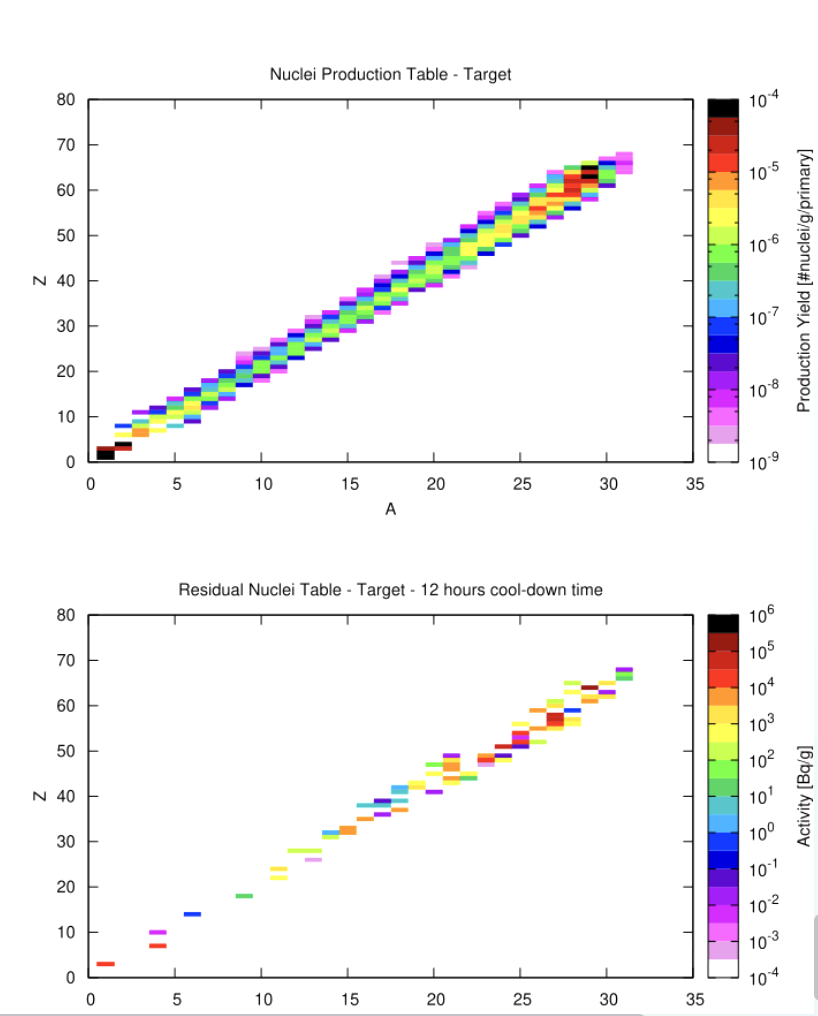
I suppose you have already figured out how produce an A-Z-Plot using FLAIR (and gnuplot). (FLAIR: Plot: Add: RESNUCLE)
Without having seen your FLAIR file, it is impossible to tell why you see only one nuclide (and which?). You may share your FLAIR file here in the post.
Concerning your idea: I am not certain having understood what your objective is. If you want to find the production yield and plot it as shown in the first plot, you can achieve this if you don’t associate a DCYSCORE card to your RESNUCLE card. There you should definitely see a larger number of isotopes being produced.
To your second question:
You have to define the different decay times and score them in different detectors. A plot such as shown (Activity vs Time) cannot be produced out of the box with FLAIR, but you have to do some post-processing on the data to produce this plot, i.e. reading the output files (.tab.lis) and aggregating the data as you need.
Good evening, I am very happy to receive your reply. For the previous questions, I almost found my mistakes. Thank you very much!
But right now I am having a very difficult problem and this is my file: 4-3碳离子几何.flair (6.4 KB) 4-3碳离子几何.out (1.5 KB)
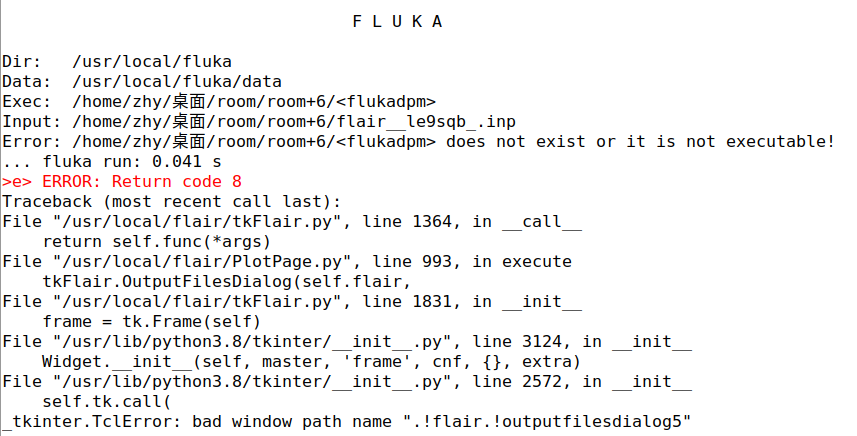
For this file, I successfully ran it last night, but strangely, I could run it this morning but I couldn’t draw a picture. I don’t know where I was wrong. Please help me see where something is wrong. The following picture is a error Additional note: For the triangle in geometry, I defined DEPRBODY in the first line, and I think it should be fine
Looking forward to your reply soon. Thank you!
This is the FLUKA prompt error, as a FLUKA beginner,I am really confused, I don’t know what is wrong, my source (particle type, location) and geometry are not problem! The group meeting is coming soon. I hope some expert can help the poor child!
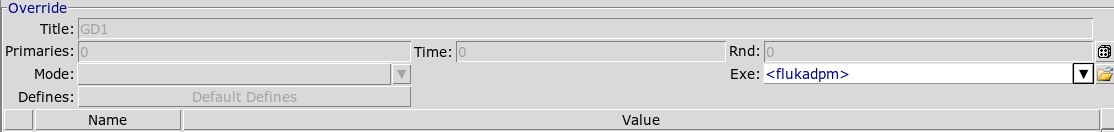
you have an error because the fluka executable was not found during plotting. This looks like a hiccup in FLAIR. I suggest you deselect in the dropdown list here in the Run menu, which may correct the issue. You then plot and reselect again.